In this post, I will be visualizing differences between psychological networks with network tree to identify how the structure of the network changes across different population subgroups.
Hi Everyone. It’s been awhile since my last blog post. Today I want to write about a network psychometrics analysis method named “Networktree”. This method is a way of visualizing differences between psychological networks between population with different characteristics.
Have you ever wondered how to measure the connections between different items in a survey? For example, how does a question asking about sadness relate to a question that asks about whether you have laughed today? One way to find out is to use psychometric networks, which are graphical models that show the strength and direction of the associations between variables.
But what if these associations are not the same for everyone? What if some factors, such as age, gender, or education, make a difference in how variables are related? This is where network trees come in. Network tree is a new method that can help you discover subgroups in your data that have different structure of psychological networks. By splitting your data based on covariates, such as demographic or clinical variables, network trees can reveal how the structure of the network changes across different groups. This can help you identify sources of heterogeneity and tailor your interventions accordingly.
In this post, we will explore a dataset that measures different kinds of vocational interest. This dataset is based on the RIASEC model, which was created by Liao, Armstrong, and Rounds (2008) to provide an alternative to the commercialized Holland RIASEC test for public research and development. RIASEC stands for realistic, investigative, artistic, social, enterprising and conventional. These are six categories of vocational interest that can help people find careers that match their personality and preferences. For example, someone who scores high on the realistic type might enjoy working with tools, machines or animals, while someone who scores high on the artistic type might enjoy creative activities such as writing, painting or music.
Before we explore how the data set is organized, we should take a look at its content. This will help us understand what kind of information it contains and how it can be useful for our analysis.
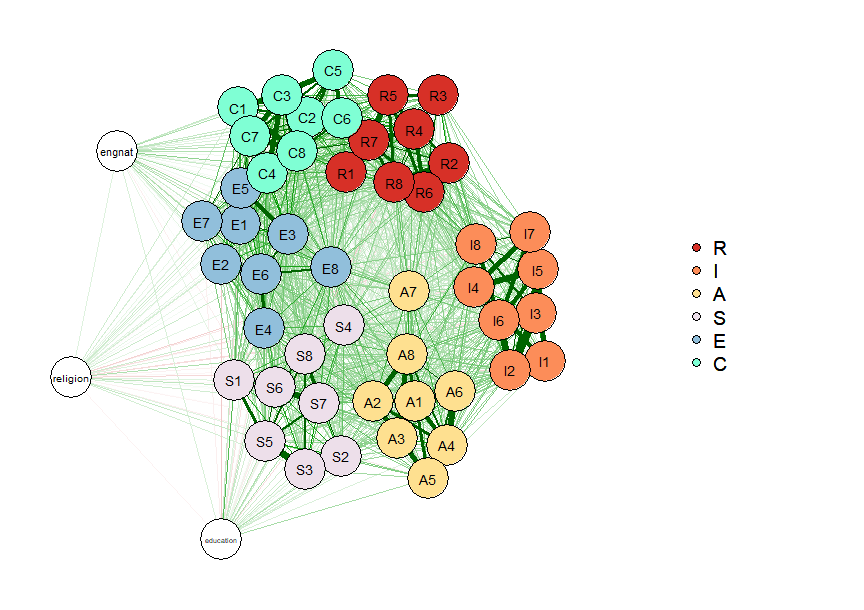
var_name<-colnames(df_subsetted)cor_RIASEC<-cor(df_subsetted[,var_name])riasec_dim<-list(R =1:8, I =9:16, A =17:24, S =25:32, E =33:40, C =41:48)q1<-qgraph::qgraph(cor_RIASEC, layout ="spring", labels =var_name, groups =riasec_dim, color=c("#d73027", "#fc8d59", "#fee090", "#eddfea", "#91bfdb", "#7FFFD4"))
Network structure of the RIASEC dataset
This is the network structure of the RIASEC dataset. It has six dimensions, represented by six clusters of items. There are also three categorical indicators of native English status (engnat), religion, and educational status.
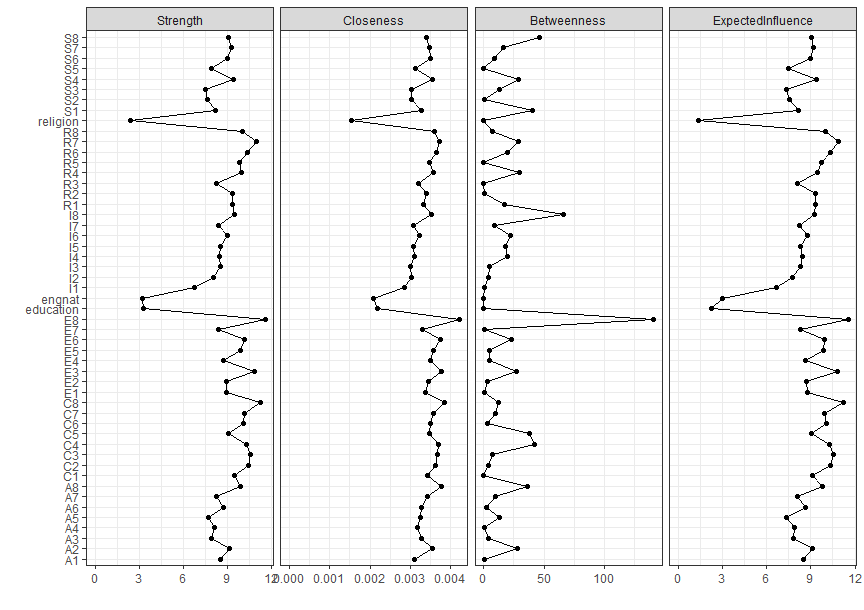
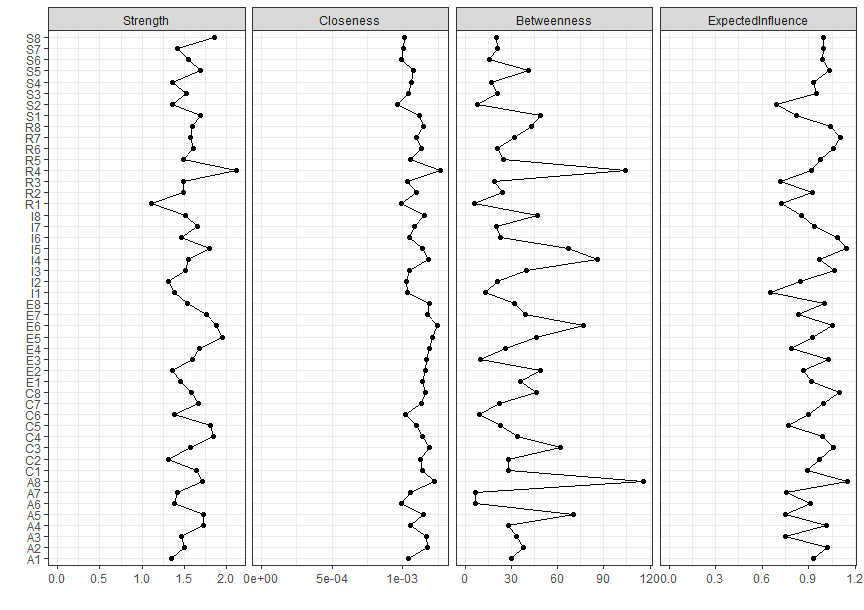
Centrality indices of the overall RIASEC network structure
These are centrality indices of the overall RIASEC structure. They are numerical values that describe how important or influential a node is in a network. There are different ways to calculate centrality indices: strength, closeness, betweenness, and expected influence (Bringmann et al., 2019; Robinaugh et al., 2016).
Strength is the sum of the weights of the edges connected to a node. It indicates how much a node is directly connected to other nodes in the network. For example, if a node has a strength value of 10, it means that it has 10 units of connection with other nodes. A high strength value can imply that a node has a dominant or prominent role in the network.
Closeness is the inverse of the average distance from a node to all other nodes in the network. It measures how easily a node can reach other nodes through the shortest paths. For example, if a node has a closeness value of 0.5, it means that the average distance from it to any other node is 2 steps. A high closeness value can indicate that a node has a central or accessible position in the network.
Betweenness is the number of shortest paths between any two nodes in the network that pass through a given node. It reflects how often a node acts as a bridge or a mediator between other nodes. For example, if a node has a betweenness value of 20, it means that 20 pairs of nodes depend on it to communicate with each other. A high betweenness value can suggest that a node has a strategic or influential role in the network.
Expected influence is the product of the strength and the closeness of a node. It represents how much impact a node can have on other nodes in the network. For example, if a node has an expected influence value of 5, it means that it can reach 5 units of connection with other nodes in one step. A high expected influence value can imply that a node has a powerful or persuasive role in the network.
By using these centrality indices, we can analyze the RIASEC structure and see which interest types are more central or peripheral in the network. This can help us understand how different interest types relate to each other and how they influence vocational choices and outcomes. For example, we can compare the centrality indices of Realistic and Artistic nodes and see how they differ in their network positions and roles.
Introducing Networktree
The network tree method is developed by Jones et al. (2020), using recursive partitioning to reveal significant differences among psychological network between subgroups of the population such as religion, educational status, and race.
Results from this method can be used to identify relationships between items (or nodes in network term) are different in psychological networks among respondents of diverse characteristics. This way, we can know which part of the assessment can be improved to make it stable across subgroups.
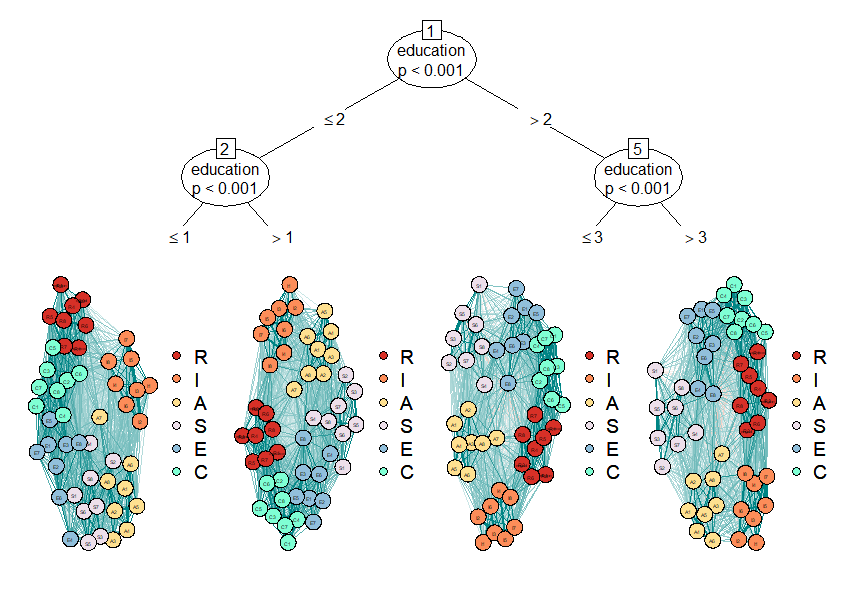
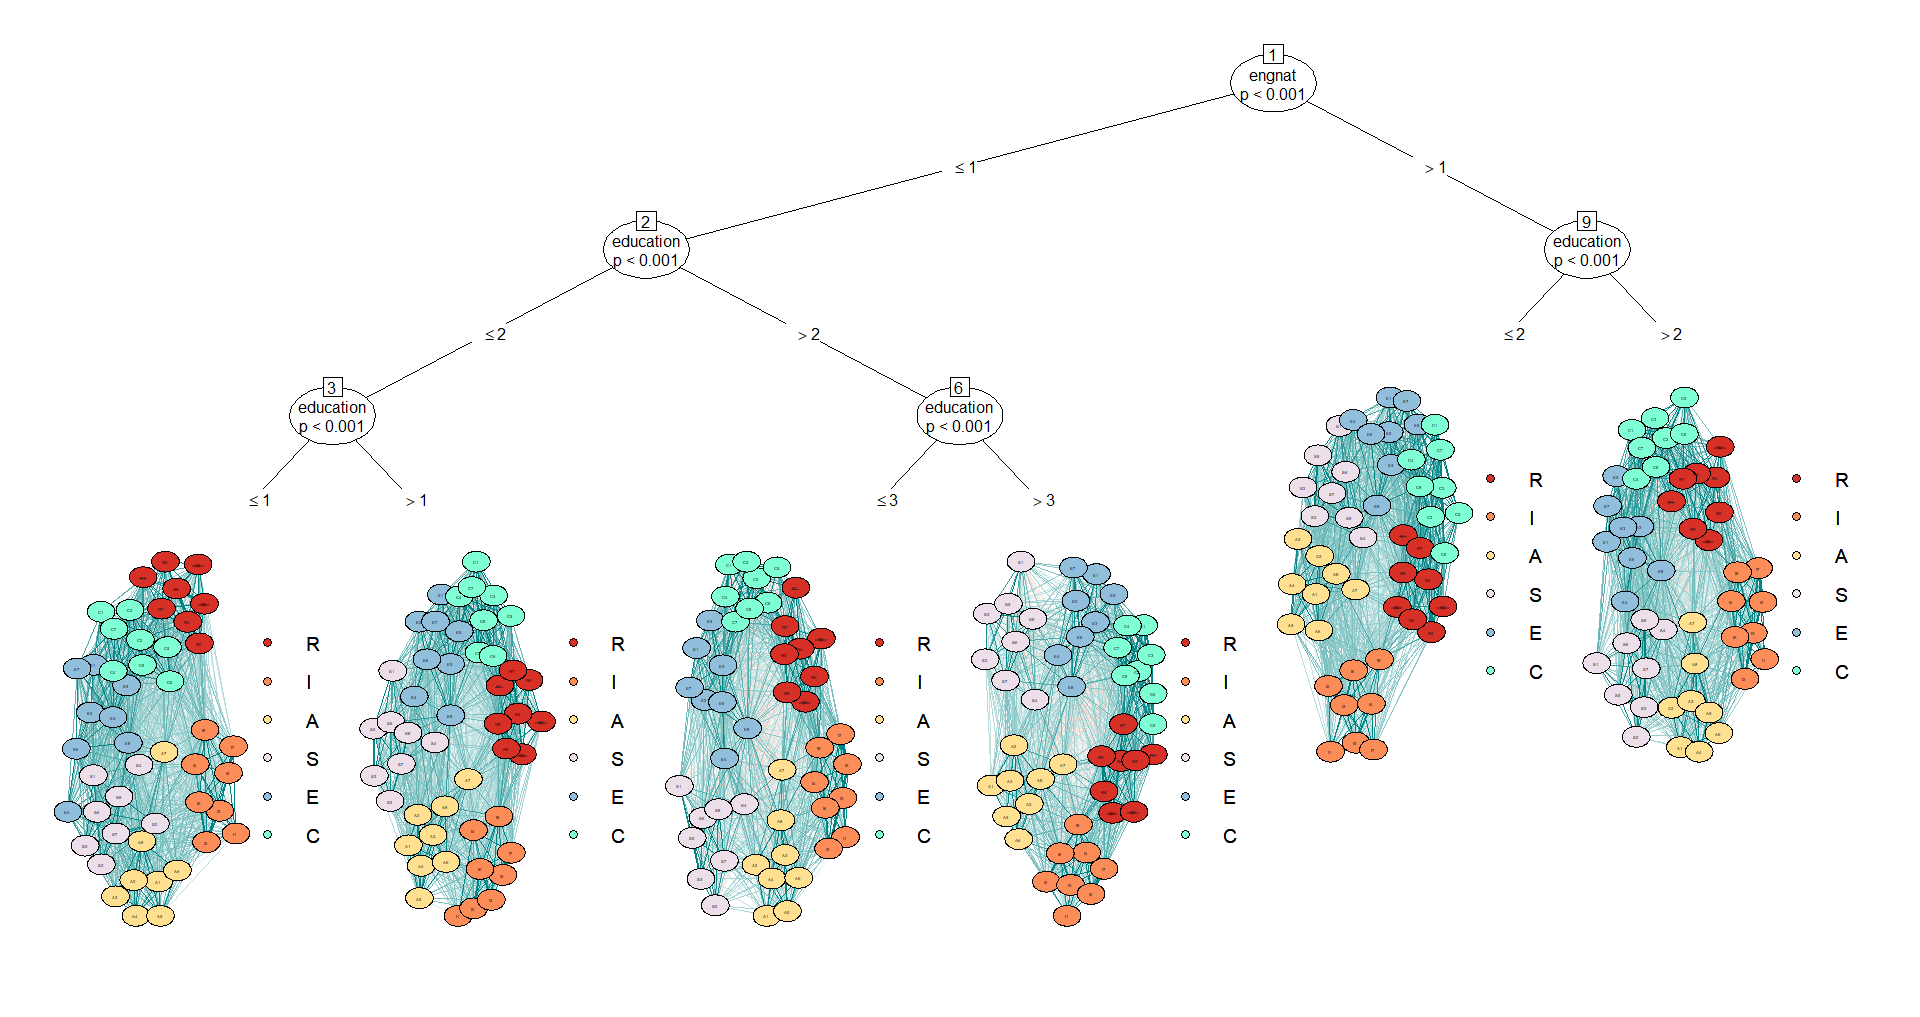
Network tree between educational level
Show code
tree2<-networktree(R1+R2+R3+R4+R5+R6+R7+R8+I1+I2+I3+I4+I5+I6+I7+I8+A1+A2+A3+A4+A5+A6+A7+A8+S1+S2+S3+S4+S5+S6+S7+S8+E1+E2+E3+E4+E5+E6+E7+E8+C1+C2+C3+C4+C5+C6+C7+C8~education, data =df_subsetted)plot(tree2, labels =var_name, layout ="spring", groups =riasec_dim, color=c("#d73027", "#fc8d59", "#fee090", "#eddfea", "#91bfdb", "#7FFFD4"))
Network tree X educational level
We can start by investigating network of the dataset as divided by educational level. 1=Less than high school, 2=High school, 3=University degree, 4=Graduate degree. It seems high school serves as the higher level split (i.e., value <= 2 or > 2). Then, the network branches further by Less than high school status and University degree (undergraduate) status.
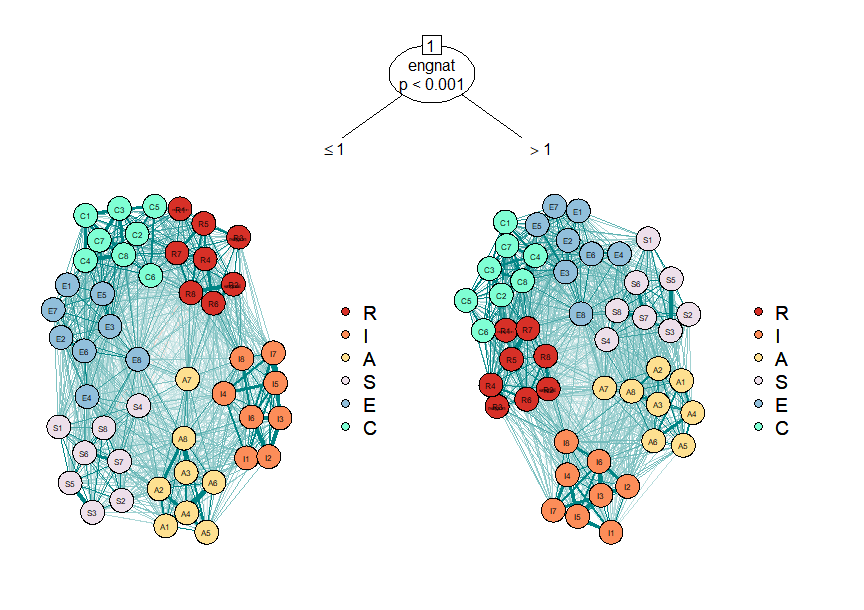
Network tree between native English status
Show code
tree3<-networktree(R1+R2+R3+R4+R5+R6+R7+R8+I1+I2+I3+I4+I5+I6+I7+I8+A1+A2+A3+A4+A5+A6+A7+A8+S1+S2+S3+S4+S5+S6+S7+S8+E1+E2+E3+E4+E5+E6+E7+E8+C1+C2+C3+C4+C5+C6+C7+C8~engnat, data =df_subsetted)plot(tree3, labels =var_name, layout ="spring", groups =riasec_dim, color=c("#d73027", "#fc8d59", "#fee090", "#eddfea", "#91bfdb", "#7FFFD4"))print(tree3)
Network tree X native English status
We can split the network by using a binary variable such as native English status, which indicates whether English is the first language of the participants (“Is English your native language?”, 1=Yes, 2=No). This variable can help us examine how language proficiency affects the network structure and dynamics.
Network tree between educational level and native English status
Show code
tree1<-networktree(R1+R2+R3+R4+R5+R6+R7+R8+I1+I2+I3+I4+I5+I6+I7+I8+A1+A2+A3+A4+A5+A6+A7+A8+S1+S2+S3+S4+S5+S6+S7+S8+E1+E2+E3+E4+E5+E6+E7+E8+C1+C2+C3+C4+C5+C6+C7+C8~education+engnat, data =df_subsetted)plot(tree1, labels =var_name, layout ="spring", groups =riasec_dim, color=c("#d73027", "#fc8d59", "#fee090", "#eddfea", "#91bfdb", "#7FFFD4"))
Network tree X educational level and native English status
Another way to partition the network is to use multiple grouping variables simultaneously. For example, we can split the network according to the educational level and the native English status of the nodes. This allows us to see how these two factors affect the network structure and dynamics.
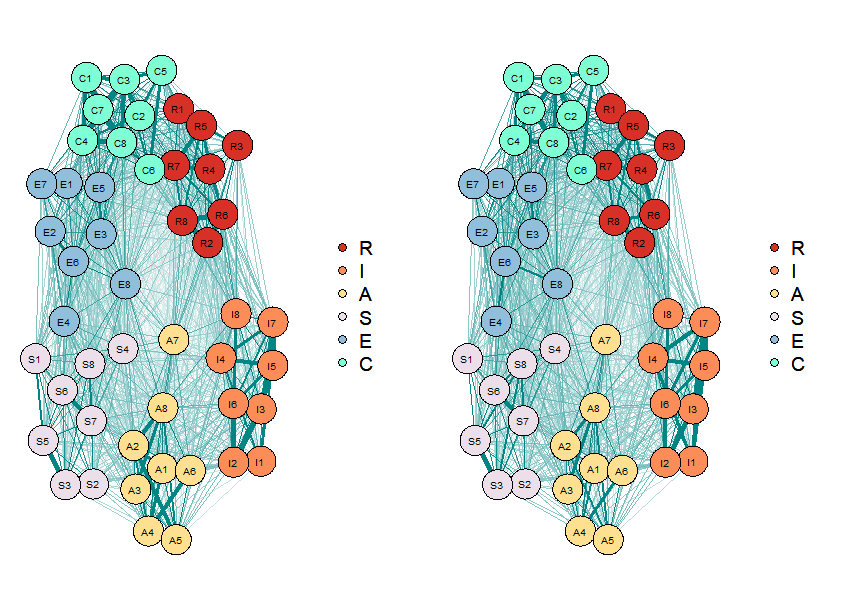
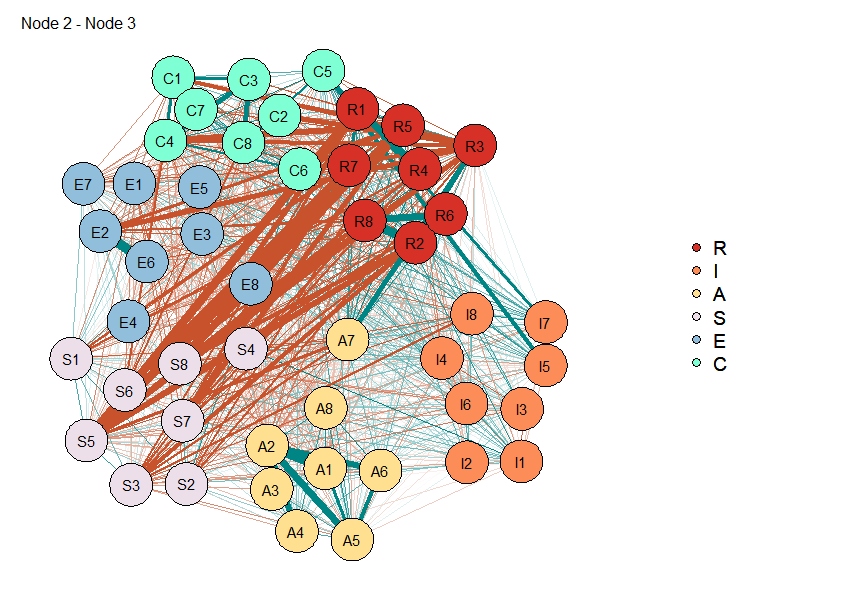
We can use compare_tree function to compare network within a tree. The compare_tree$highlights code displays information of nodes with significant different between the two trees.
One way to analyze the network structure within a tree is to use the compare_tree function. This function takes a network tree as an input and returns network structures within that tree as an output. The compare_tree$highlights code can be used to display the information of nodes with significant different between the two networks.
Another option for plotting the network is to set plot.type = “subtract”, which will highlight the edges that indicate differences between nodes in red. This can help us visually identify which node is an outlier or dissimilar from the rest, especially for a network with a small number of nodes.
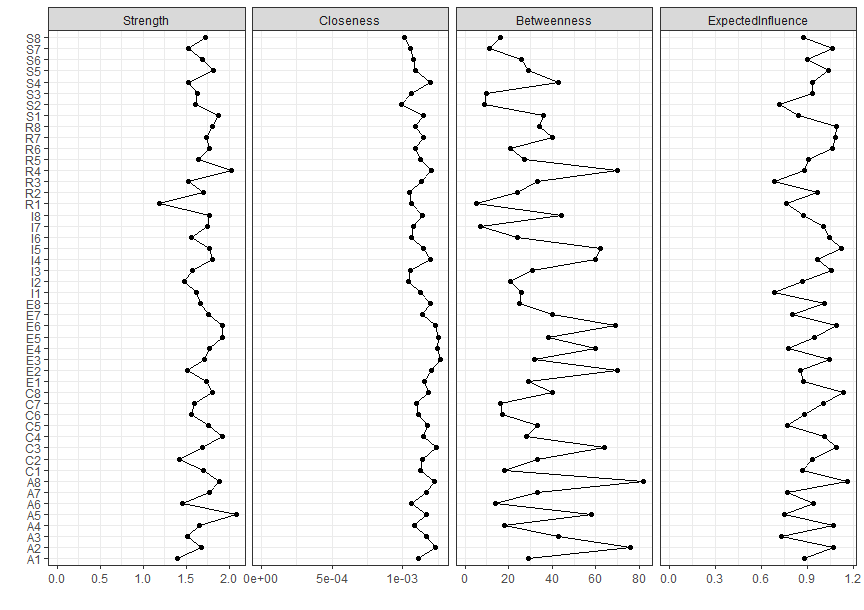
Compare centrality indices between two subgroups
Show code
engnat1<-df_subsetted%>%filter(engnat==1)engnat2<-df_subsetted%>%filter(engnat==2)net_engnat1<-bootnet::estimateNetwork(engnat1[, 1:48], default ="ggmModSelect", verbose =FALSE)net_engnat2<-bootnet::estimateNetwork(engnat2[, 1:48], default ="ggmModSelect", verbose =FALSE)qgraph::centralityPlot(net_engnat1, include ="all")qgraph::centralityPlot(net_engnat2, include ="all")
Centrality engnat1Centrality engnat2
To investigate further, we can subset the dataset by characteristics of the respondent and find differences between networks from their centrality indices. I am going to need you to squint your eyes here. Node R2, A1, A2 has different strengths (as examined visually) depending on whether the respondents are native English speakers or not.
Concluding remark
Thank you for reading this far! Network tree is a relatively novel data analysis method that could be useful in the development of assessments in addition to the existing psychometrics analyses such as differential item functioning or factor analysis. I enjoy experimenting with new ways of analyzing data, and I will share any results that I find on this platform. I appreciate your attention!
Reuse
Text and figures are licensed under Creative Commons Attribution CC BY 4.0. The figures that have been reused from other sources don't fall under this license and can be recognized by a note in their caption: "Figure from ...".
Citation
For attribution, please cite this work as
Wongvorachan (2023, Dec. 8). Tarid Wongvorachan: Examining Differences among Psychological Networks with Network Tree. Retrieved from https://taridwong.github.io/posts/2023-12-08-networktree/
BibTeX citation
@misc{wongvorachan2023examining,
  author = {Wongvorachan, Tarid},
  title = {Tarid Wongvorachan: Examining Differences among Psychological Networks with Network Tree},
  url = {https://taridwong.github.io/posts/2023-12-08-networktree/},
  year = {2023}
}