Tarid Wongvorachan
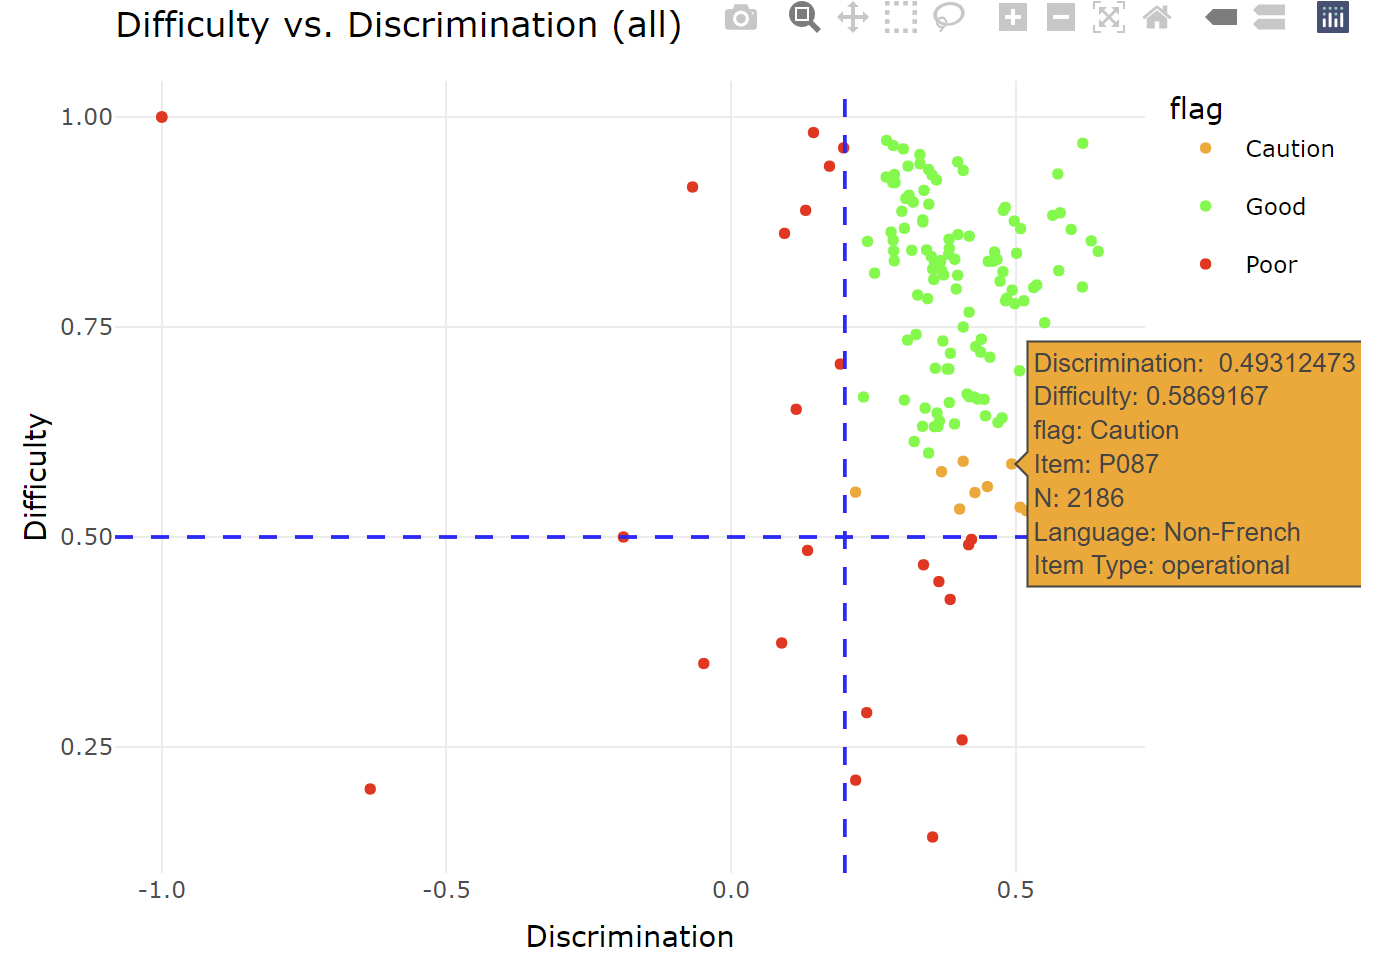
Visualizing Item Analysis: Creating Interactive Plots for Educational Assessments
In this post, I demonstrate how to create interactive item analysis plots for educational assessments using R packages. (5 min read)
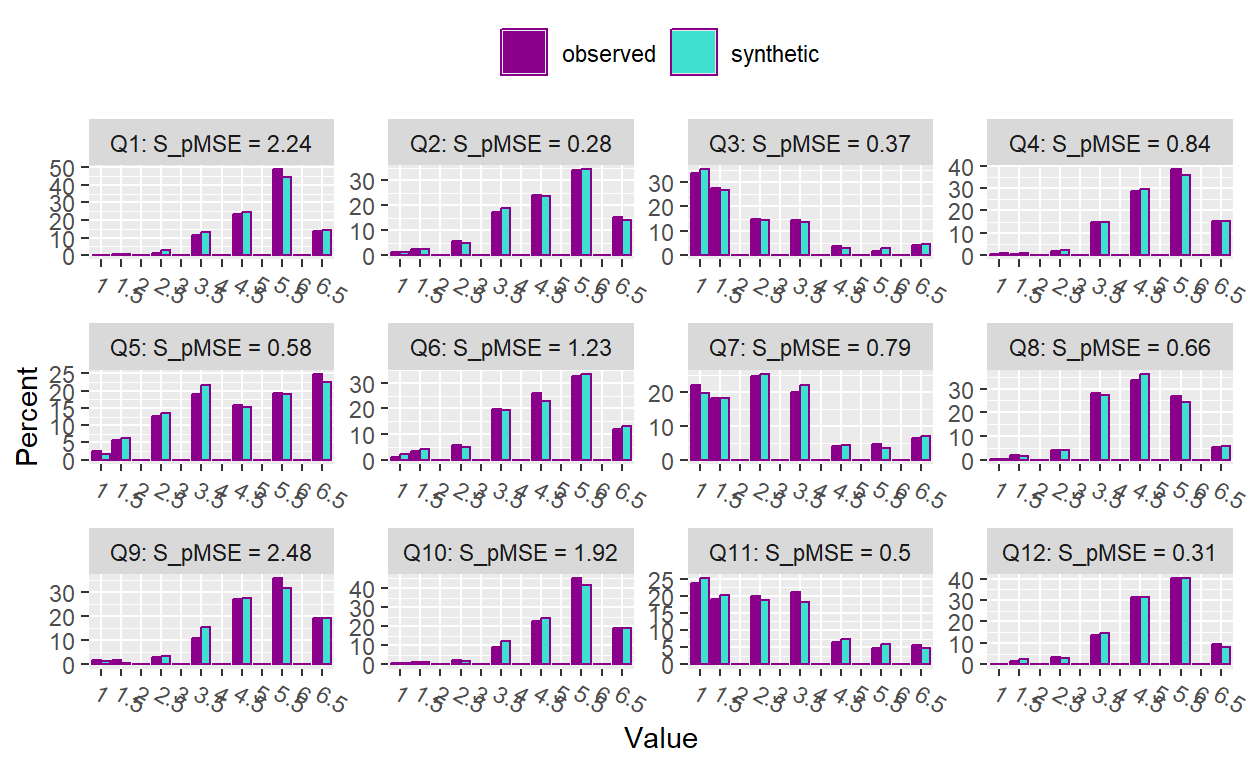
Evaluating Synthetic Data with A Psychometric Approach
This blog post explores the use of psychometric methods—such as item analysis, independent t-tests, and item response theory (IRT)—to evaluate the quality of synthetic survey data. (13 min read)
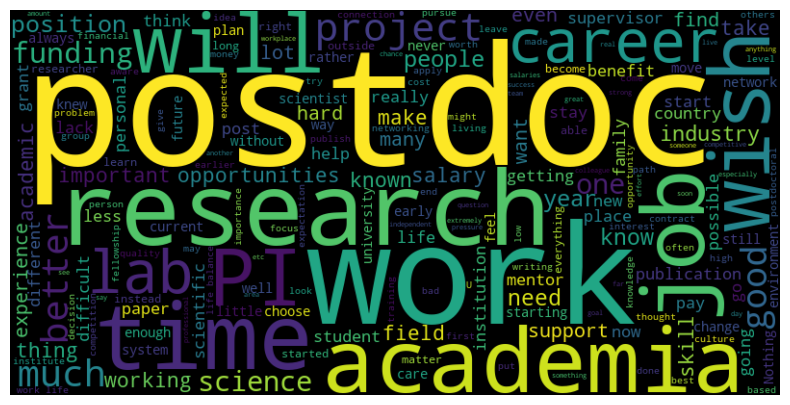
Exploring Nature's 2023 postdoc survey with predictive modeling and NLP
In this post, I will be exploring factors that influence postdoctoral researchers' perspective to career in scientific research with predictive modeling and natural language processing (NLP). (16 min read)
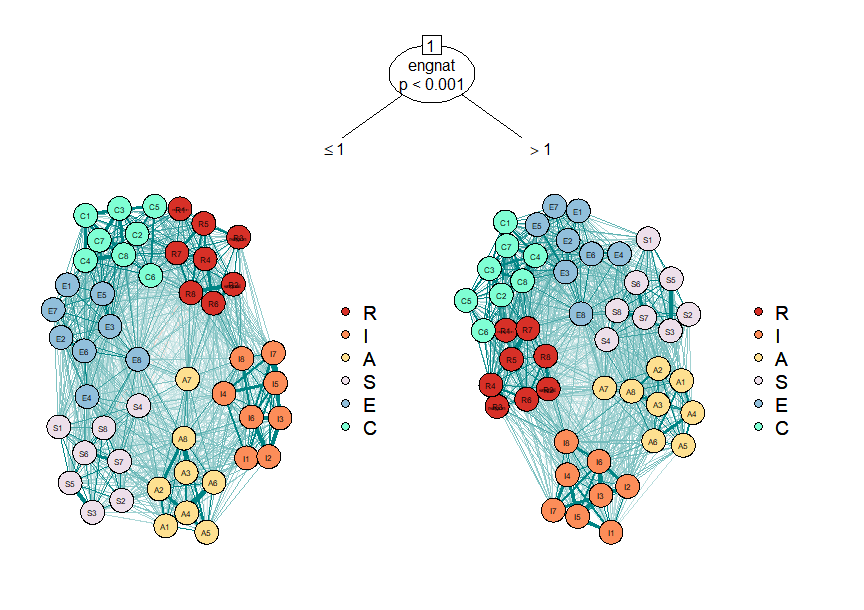
Examining Differences among Psychological Networks with Network Tree
In this post, I will be visualizing differences between psychological networks with network tree to identify how the structure of the network changes across different population subgroups. (7 min read)
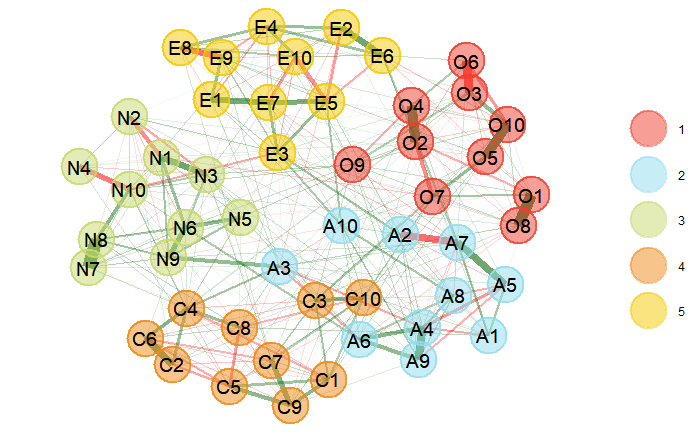
Examining Big 5 Personality Inventory Data with Network Psychometrics
In this post, I will be examining response data from Big 5 Personality Inventory with the Network psychometrics approach. (7 min read)
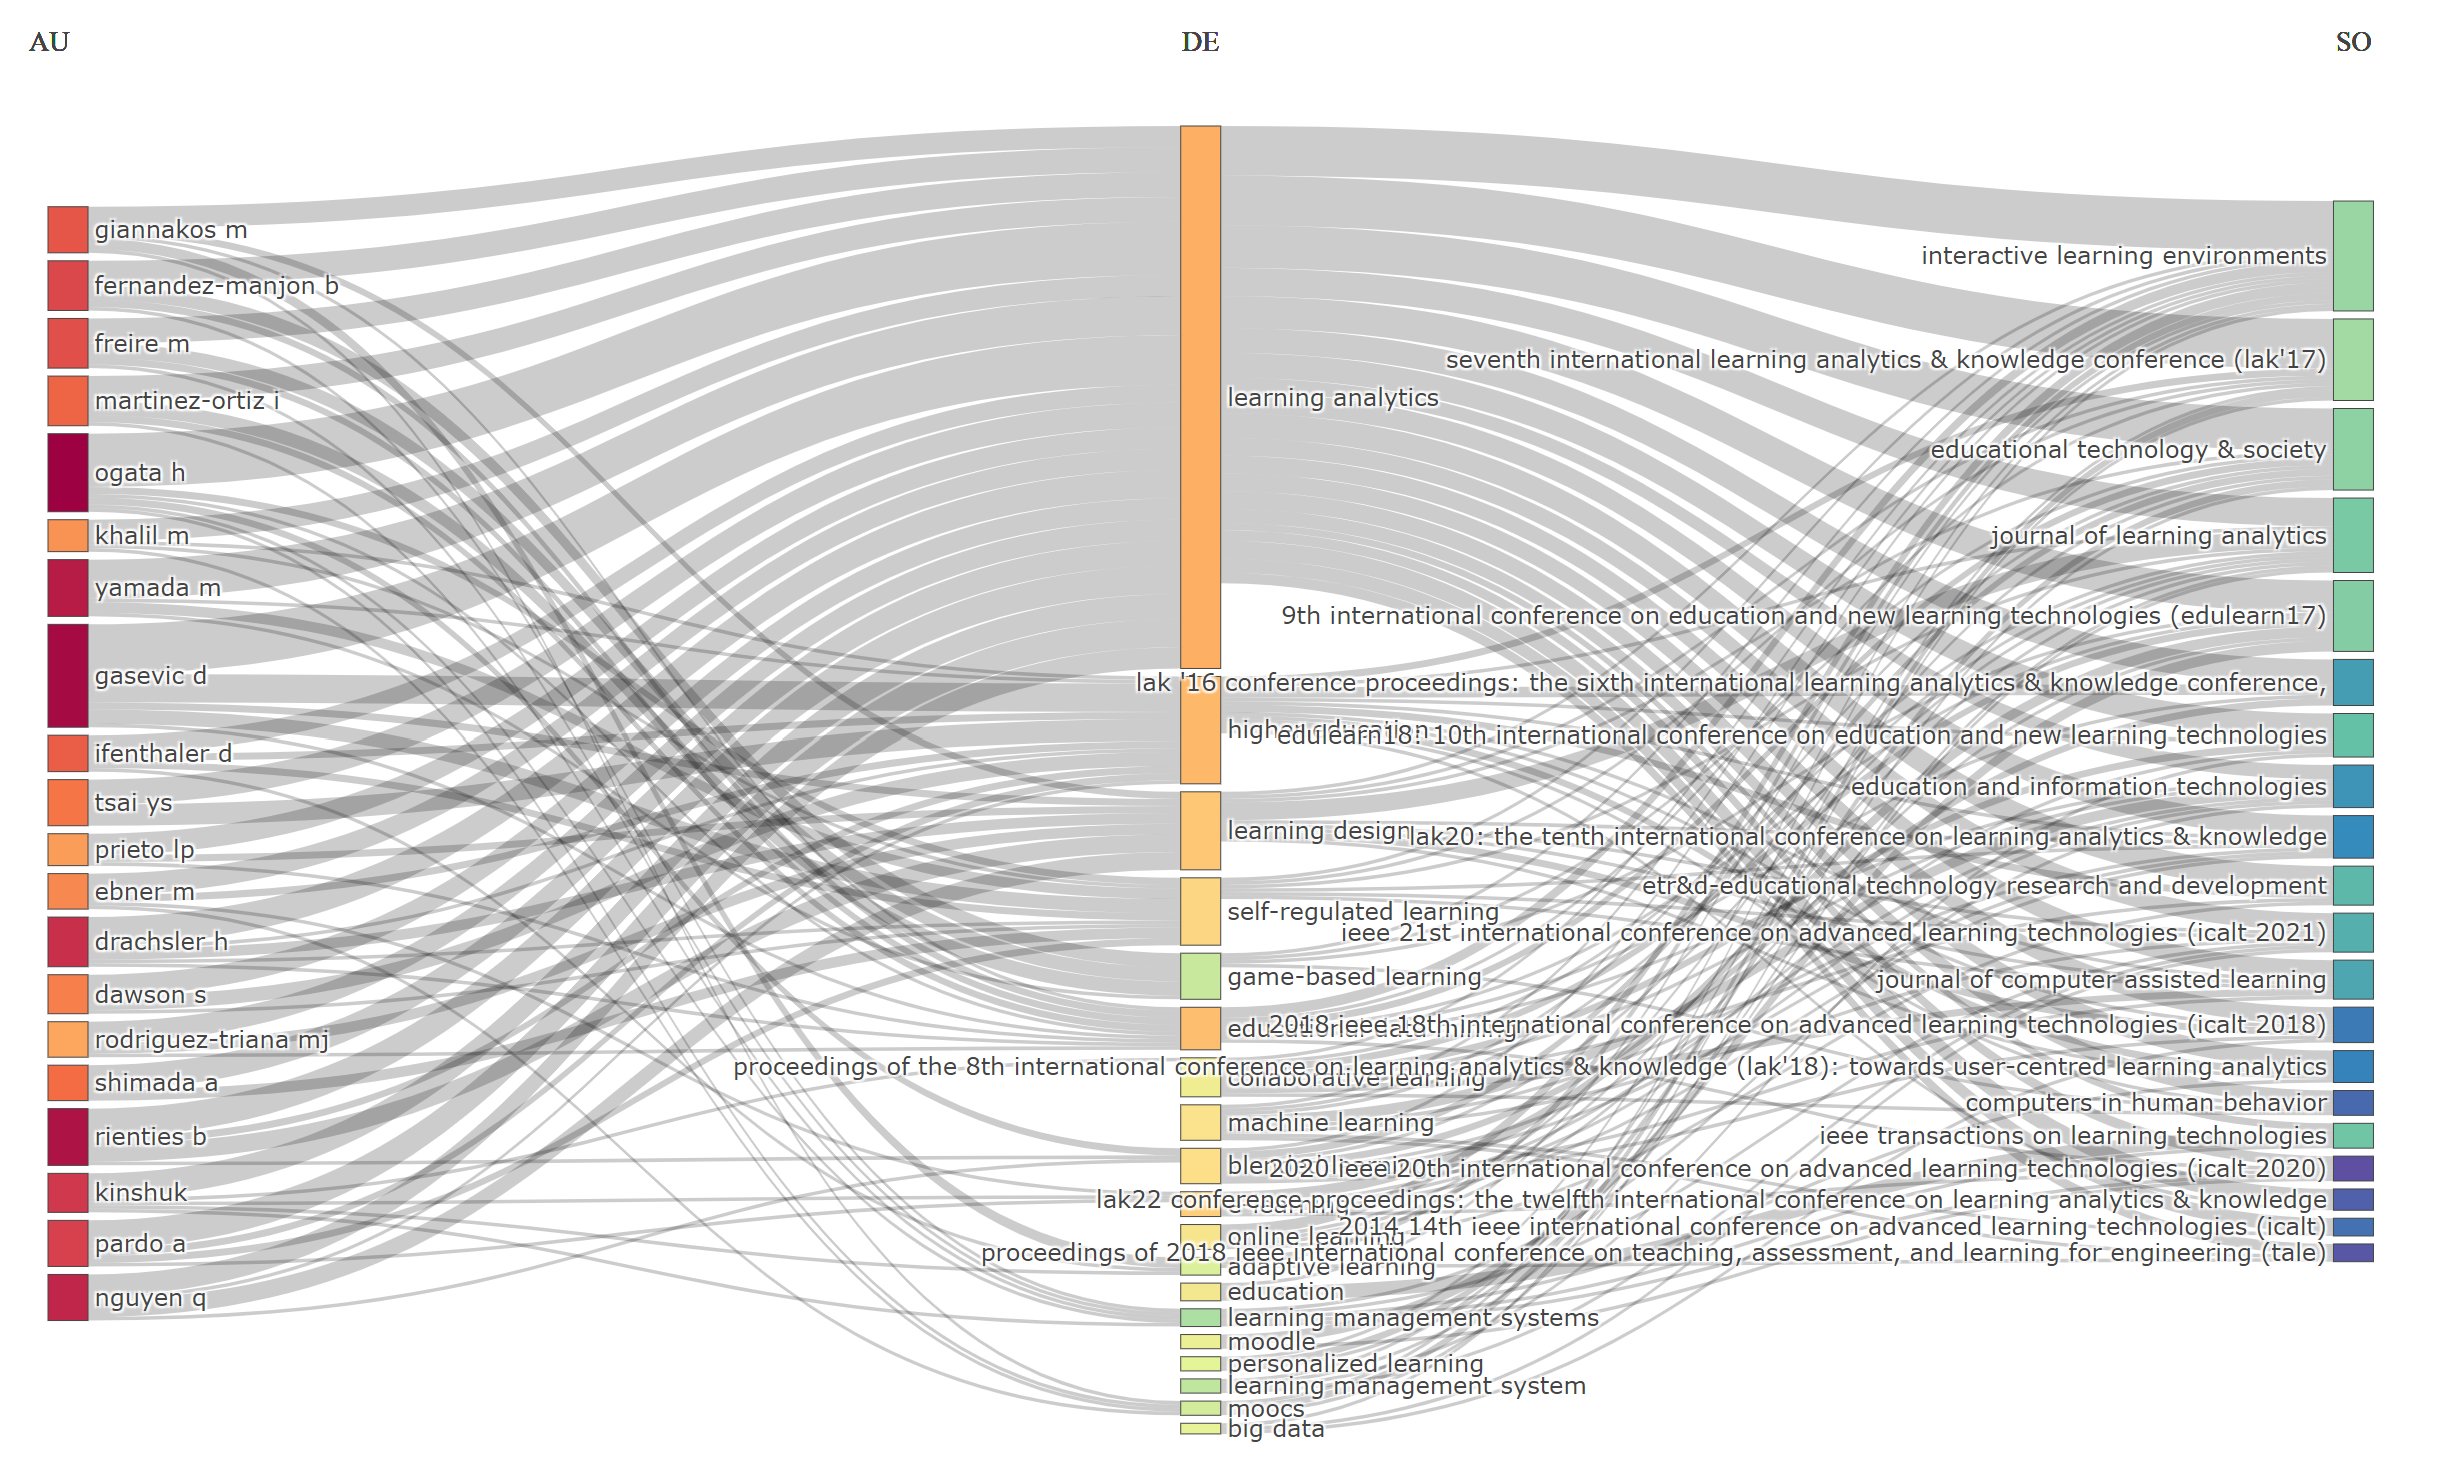
Examining State of the Field with Bibliometric Analysis
In this post, I will be performing bibliometric analysis to examine state of the field from bibliographic records. (7 min read)
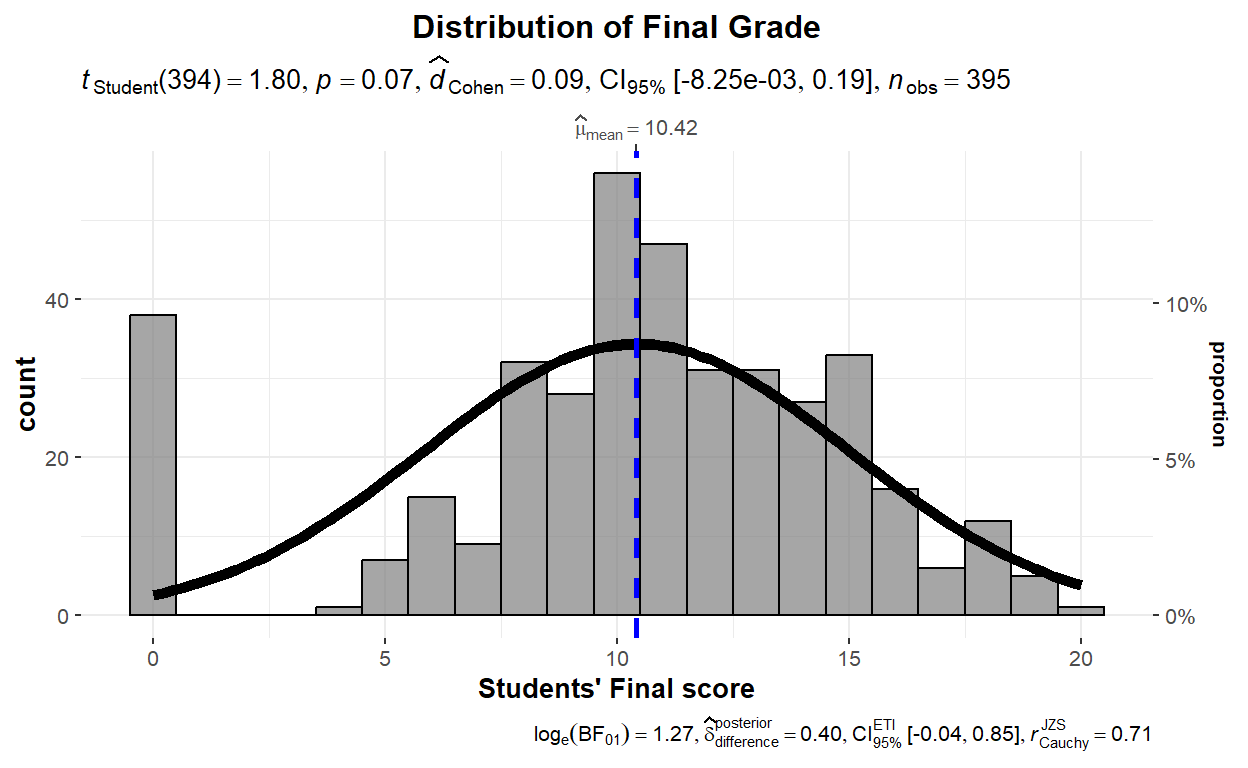
Data Exploration with ggstatsplot
In this post, I will be performing and visualizing data exploration techniques such as Pearson's correlation test, Chi-square Goodness of Fit test, Chi-square Test of Independence, One-sample t-test, and Paired-sample t-test. (8 min read)
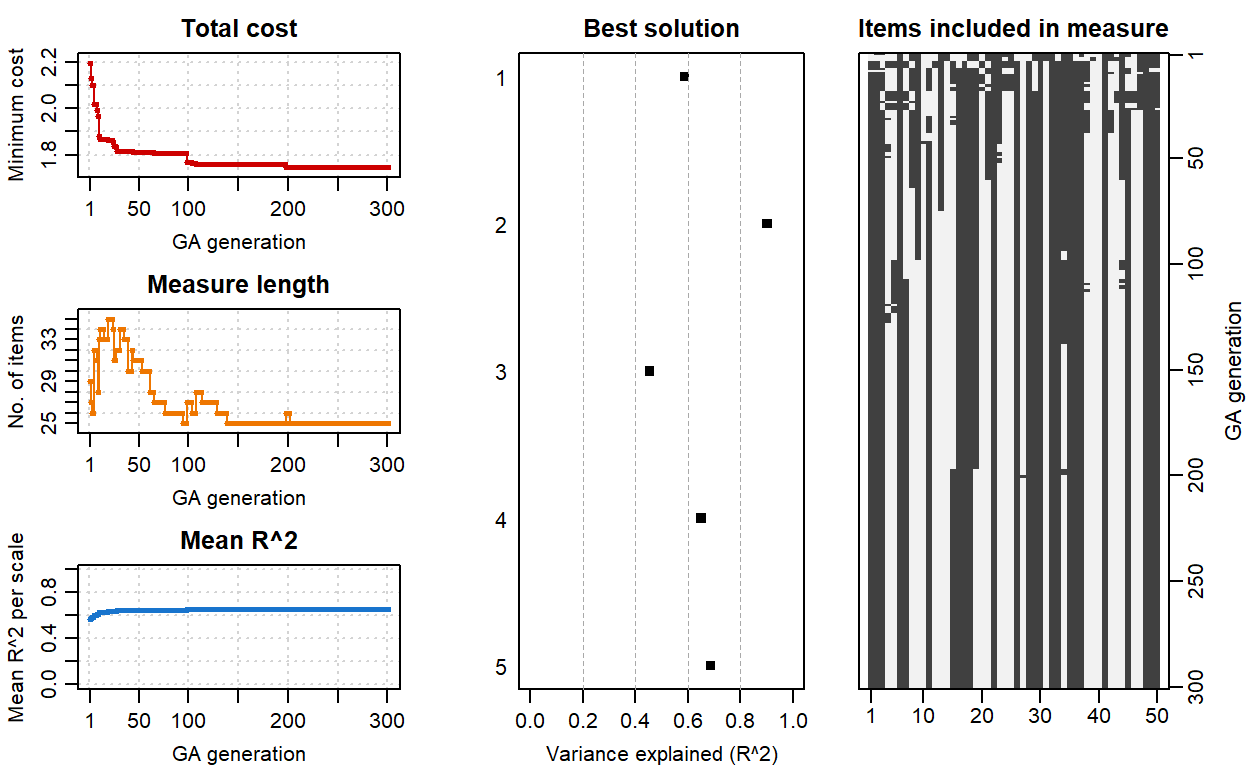
Test Shortening with Genetic Algorithm and Ant Colony Optimization
In this post, I will use Genetic Algorithm and Ant Colony Optimization Algorithm to automatically shorten the length of a test. (8 min read)
Leveraging a Large-Scale Educational Data Set with Educational Data Mining
In this post, I will be predicting students' high school dropout rate through a large-scale educational data set. (10 min read)
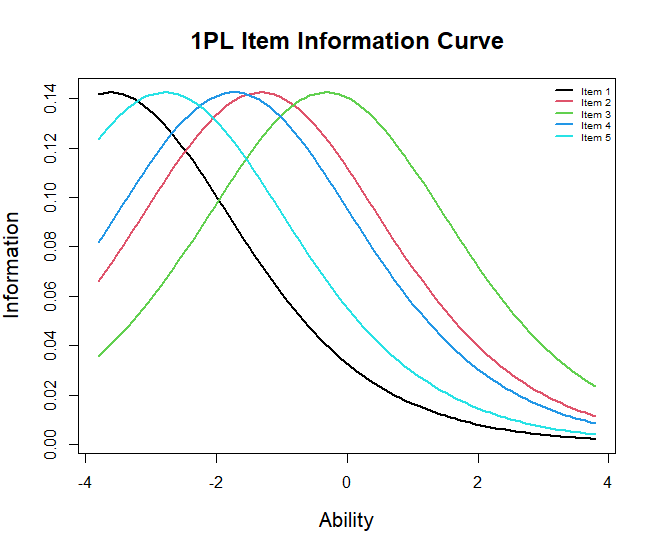
Item Response Theory
In this post, I will be examining characteristics of test items based on the Item Response Theory framework. (18 min read)
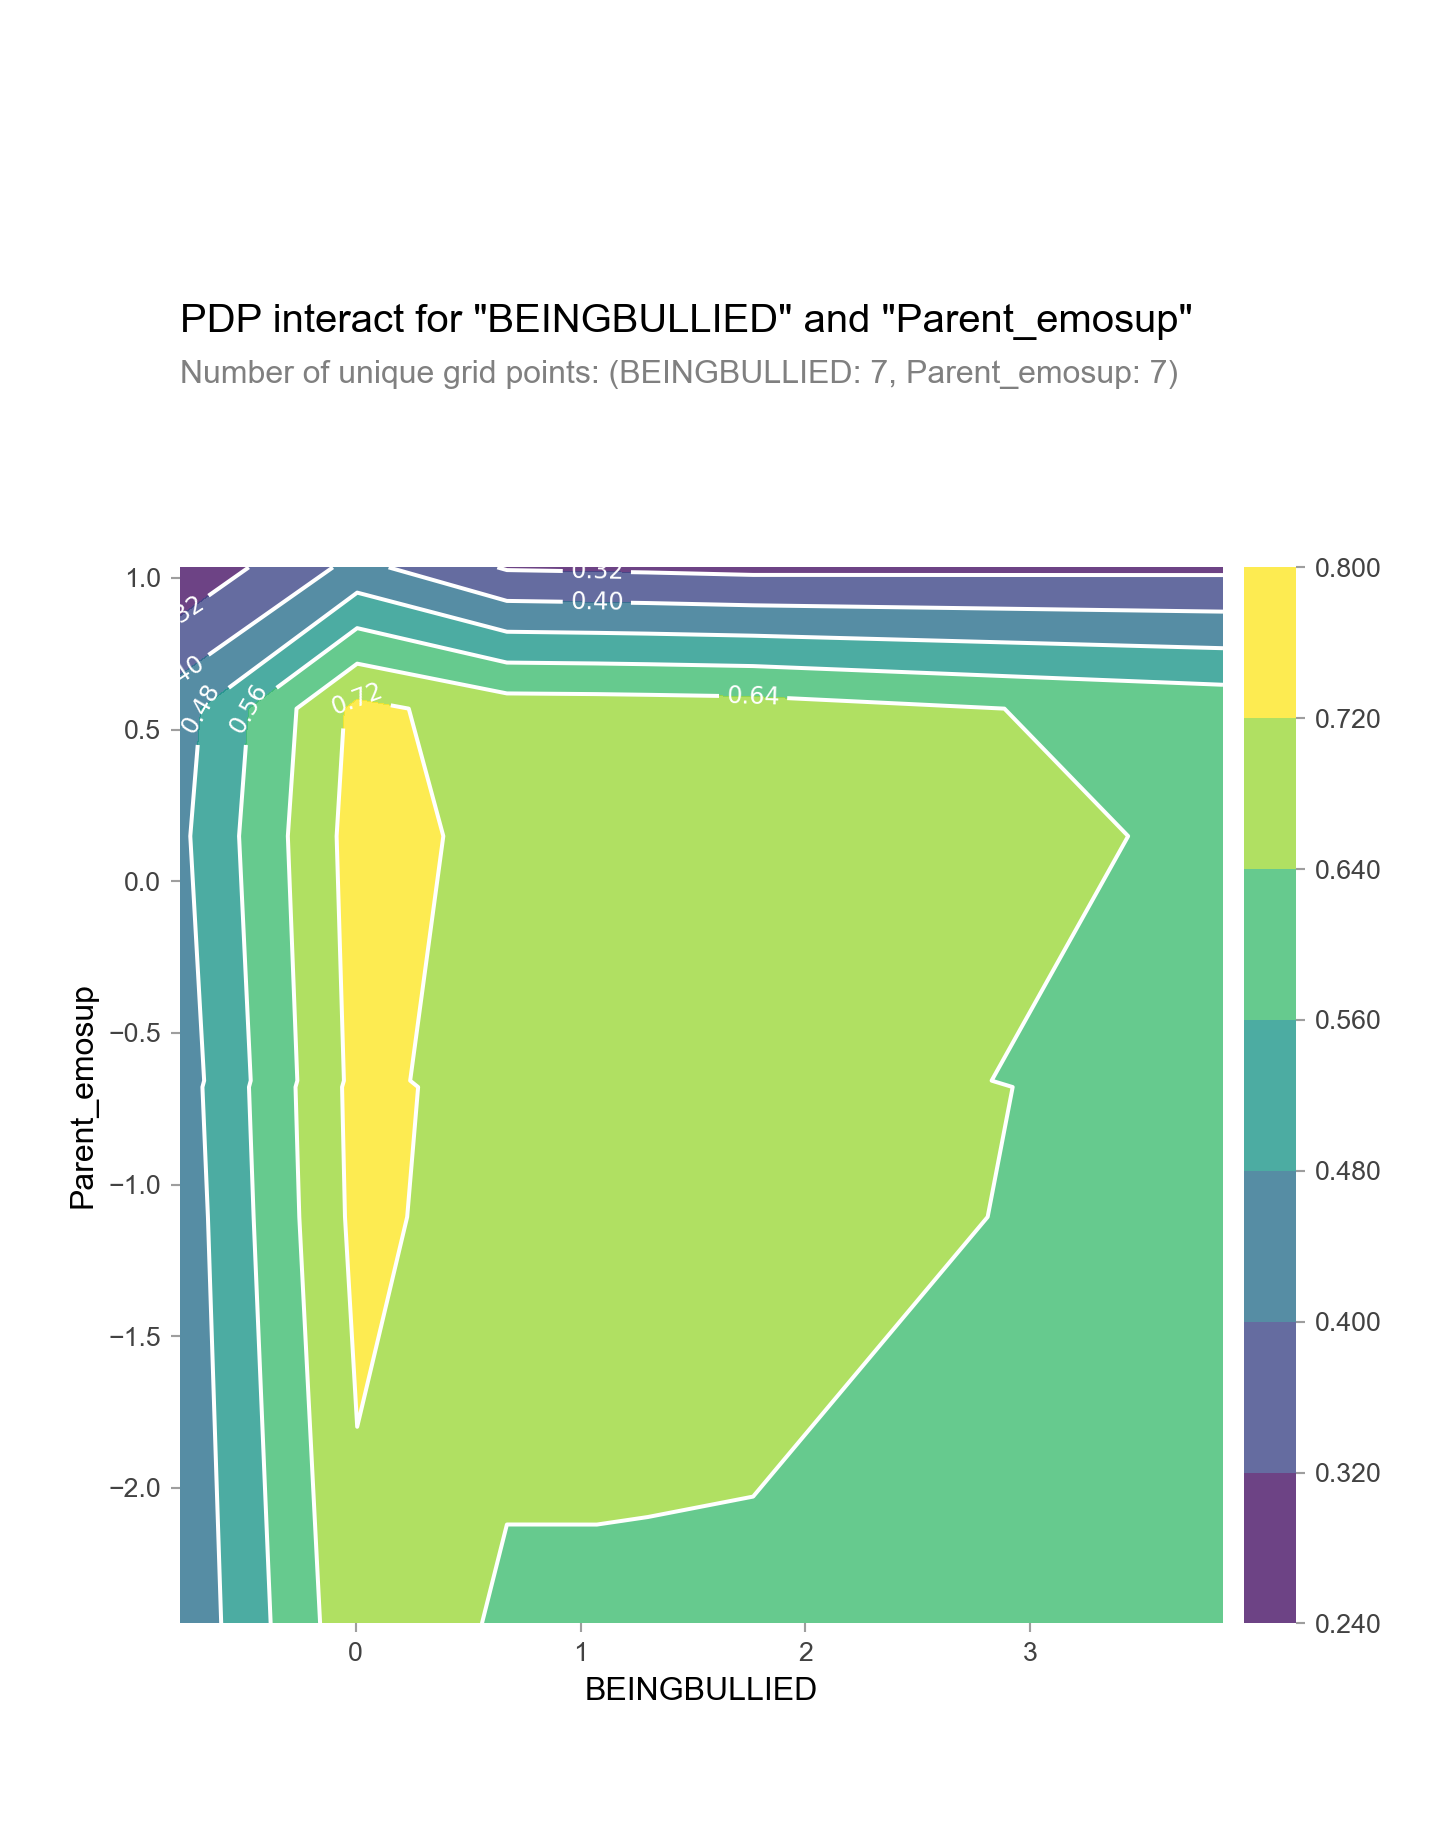
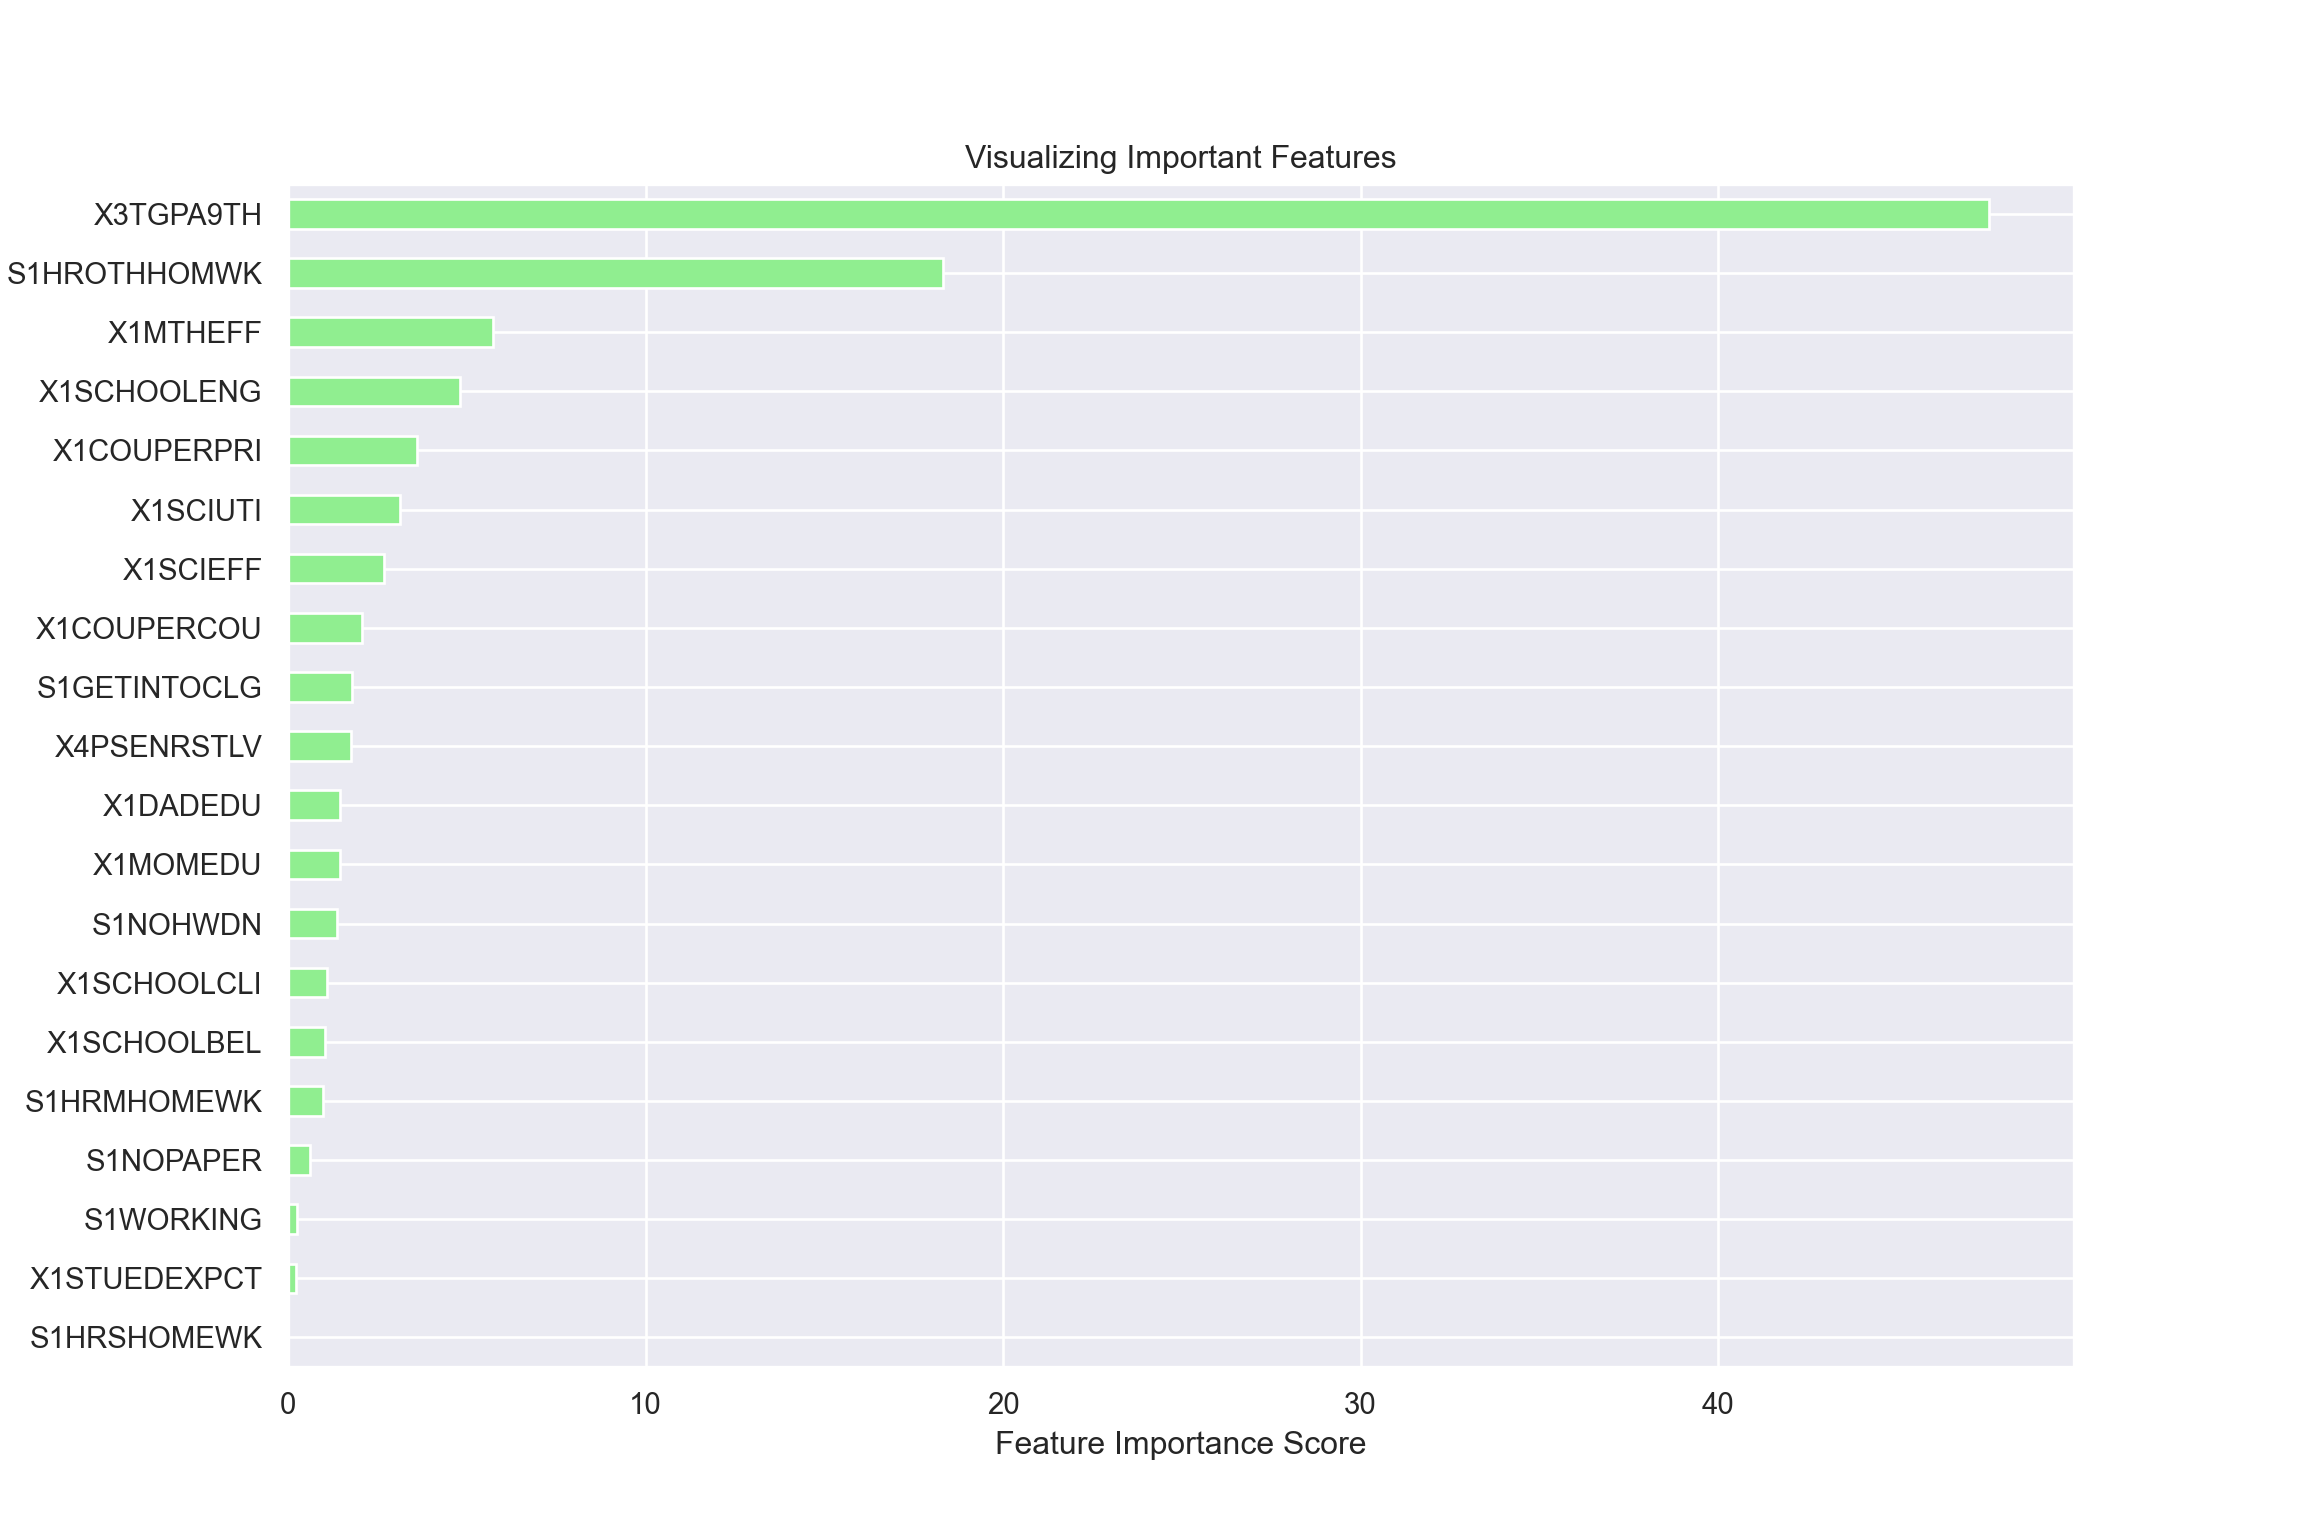
Making Sense of Machine Learning with Explanable Artificial Intelligence
I will be applying the methods of Explanable Artificial Intelligence (XAI) to extract interpretable insights from a classification model that predicts students' grade repetition. (14 min read)
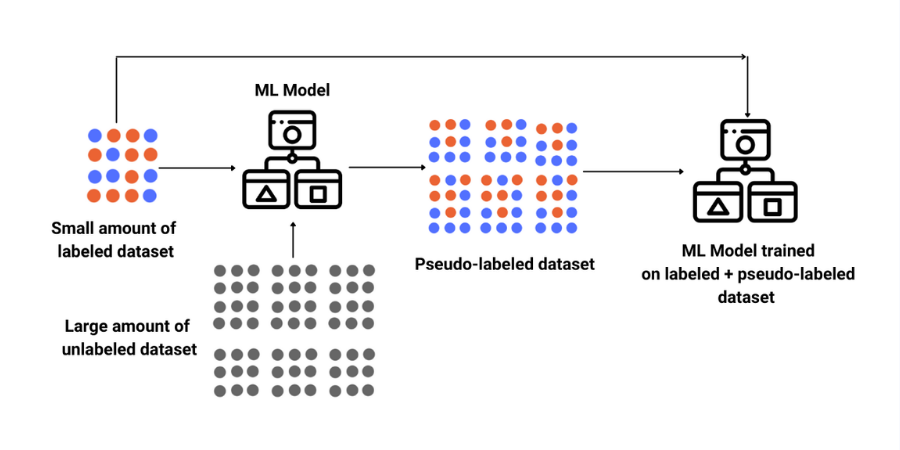
Addressing Data Imbalance with Semi-Supervised Learning
For this post, I will use semi-supervised learning approach to perform a classification task with a highly imbalance data. (7 min read)
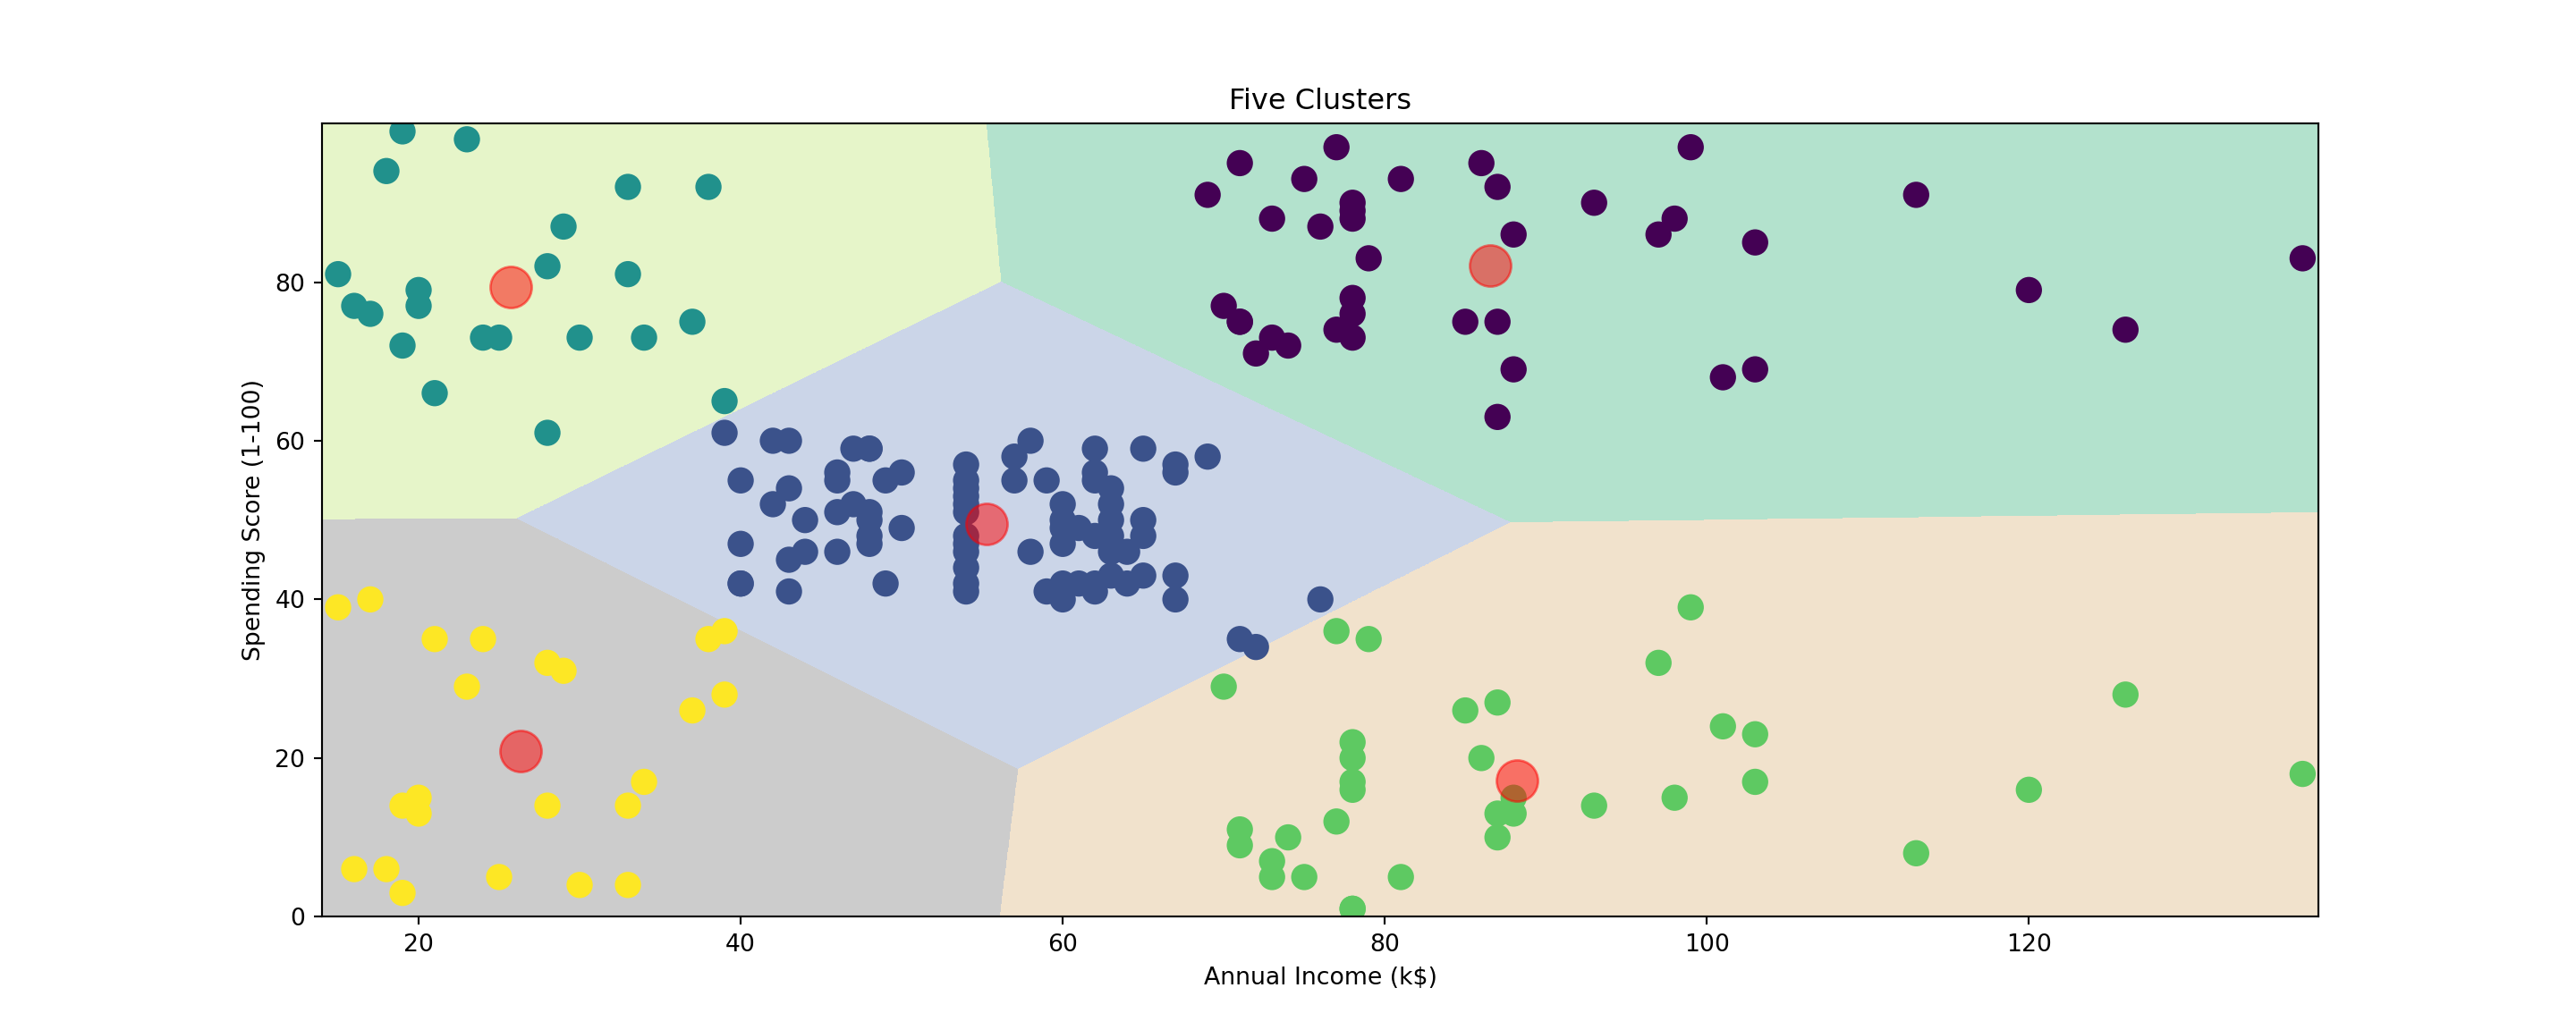
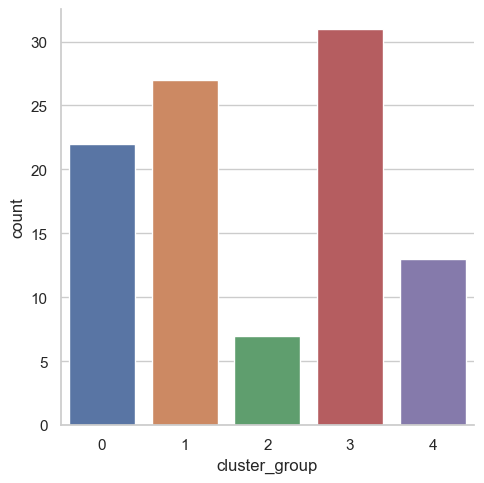
Examining Customer Cluster with Unsupervised Machine Learning
In this post, I will be using two unsupervised learning techniques with a data set, namely K-means clustering and Hierarchical clustering, to determine groups of customers from their age, income, and spending behavior data. (8 min read)

Combining Multiple Machine Learning Models with the Ensemble Methods
This entry explores different ways to combine supervised machine learning models to maximize their predictive capability. (13 min read)
Examining PISA 2018 Data Set with Statistical Learning Approach
In this post, I will be developing two statistical learning models, namely Linear Regression and Polynomial Regression, and apply it to Thai student data from the Programme for International Student Assessment (PISA) 2018 data set to examine the impact of classroom competition and cooperation to students' academic performance. (14 min read)
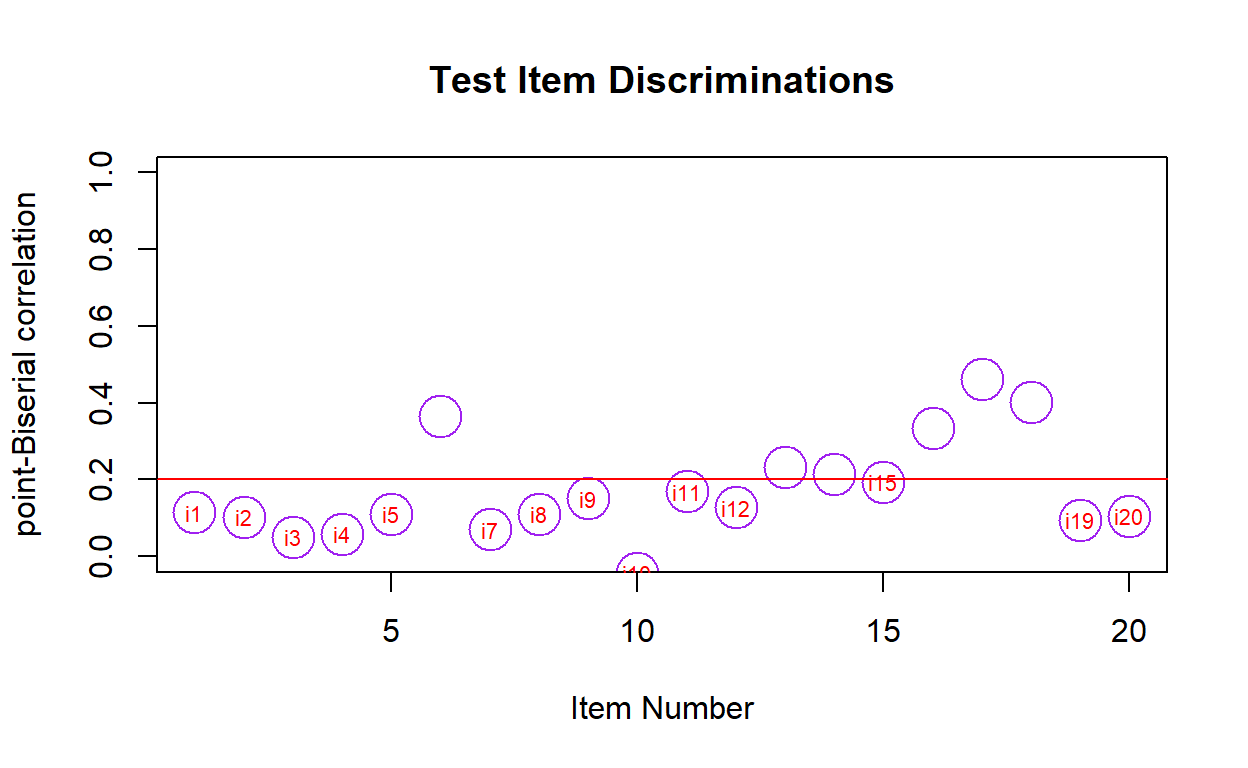
Classical Test Theory in R
For this post, I will be analyzing characteristics of test items based on the framework of Classical Test Theory (CTT). (13 min read)
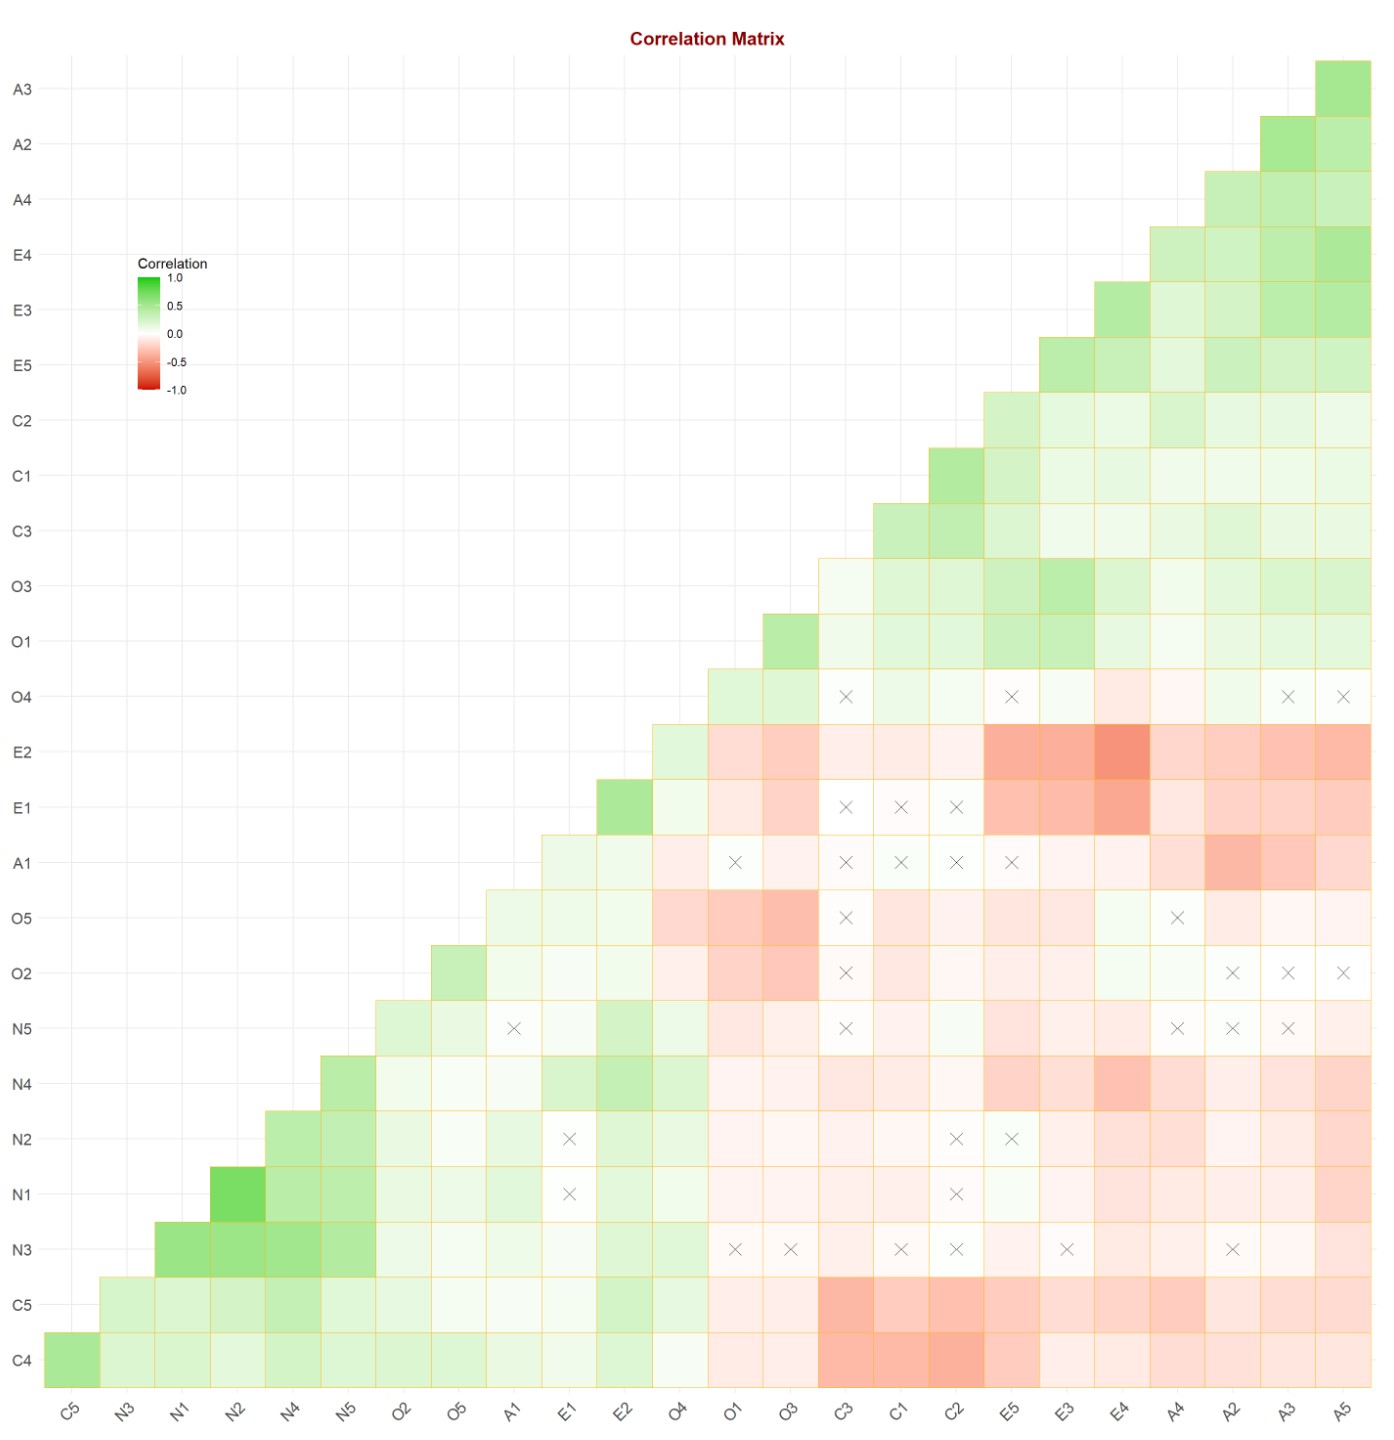
Examining the Big 5 personality Dataset with factor analysis
For this entry, I will be examining the Big 5 personality Inventory data set with Exploratory Data Analysis to identify potential structures of personality trait and verify them with Confirmatory Factor Analysis. (8 min read)
Measuring Text Similarity with Movie plot data
For this post, I will be analyzing textual data of movie plots to determine their similarity with TF-IDF and Clustering. (7 min read)
Missing Data Analysis
For this post, I will examine missing data in a large-scale dataset and discuss about numerous ways we can clean them as a part of data preparation. (10 min read)
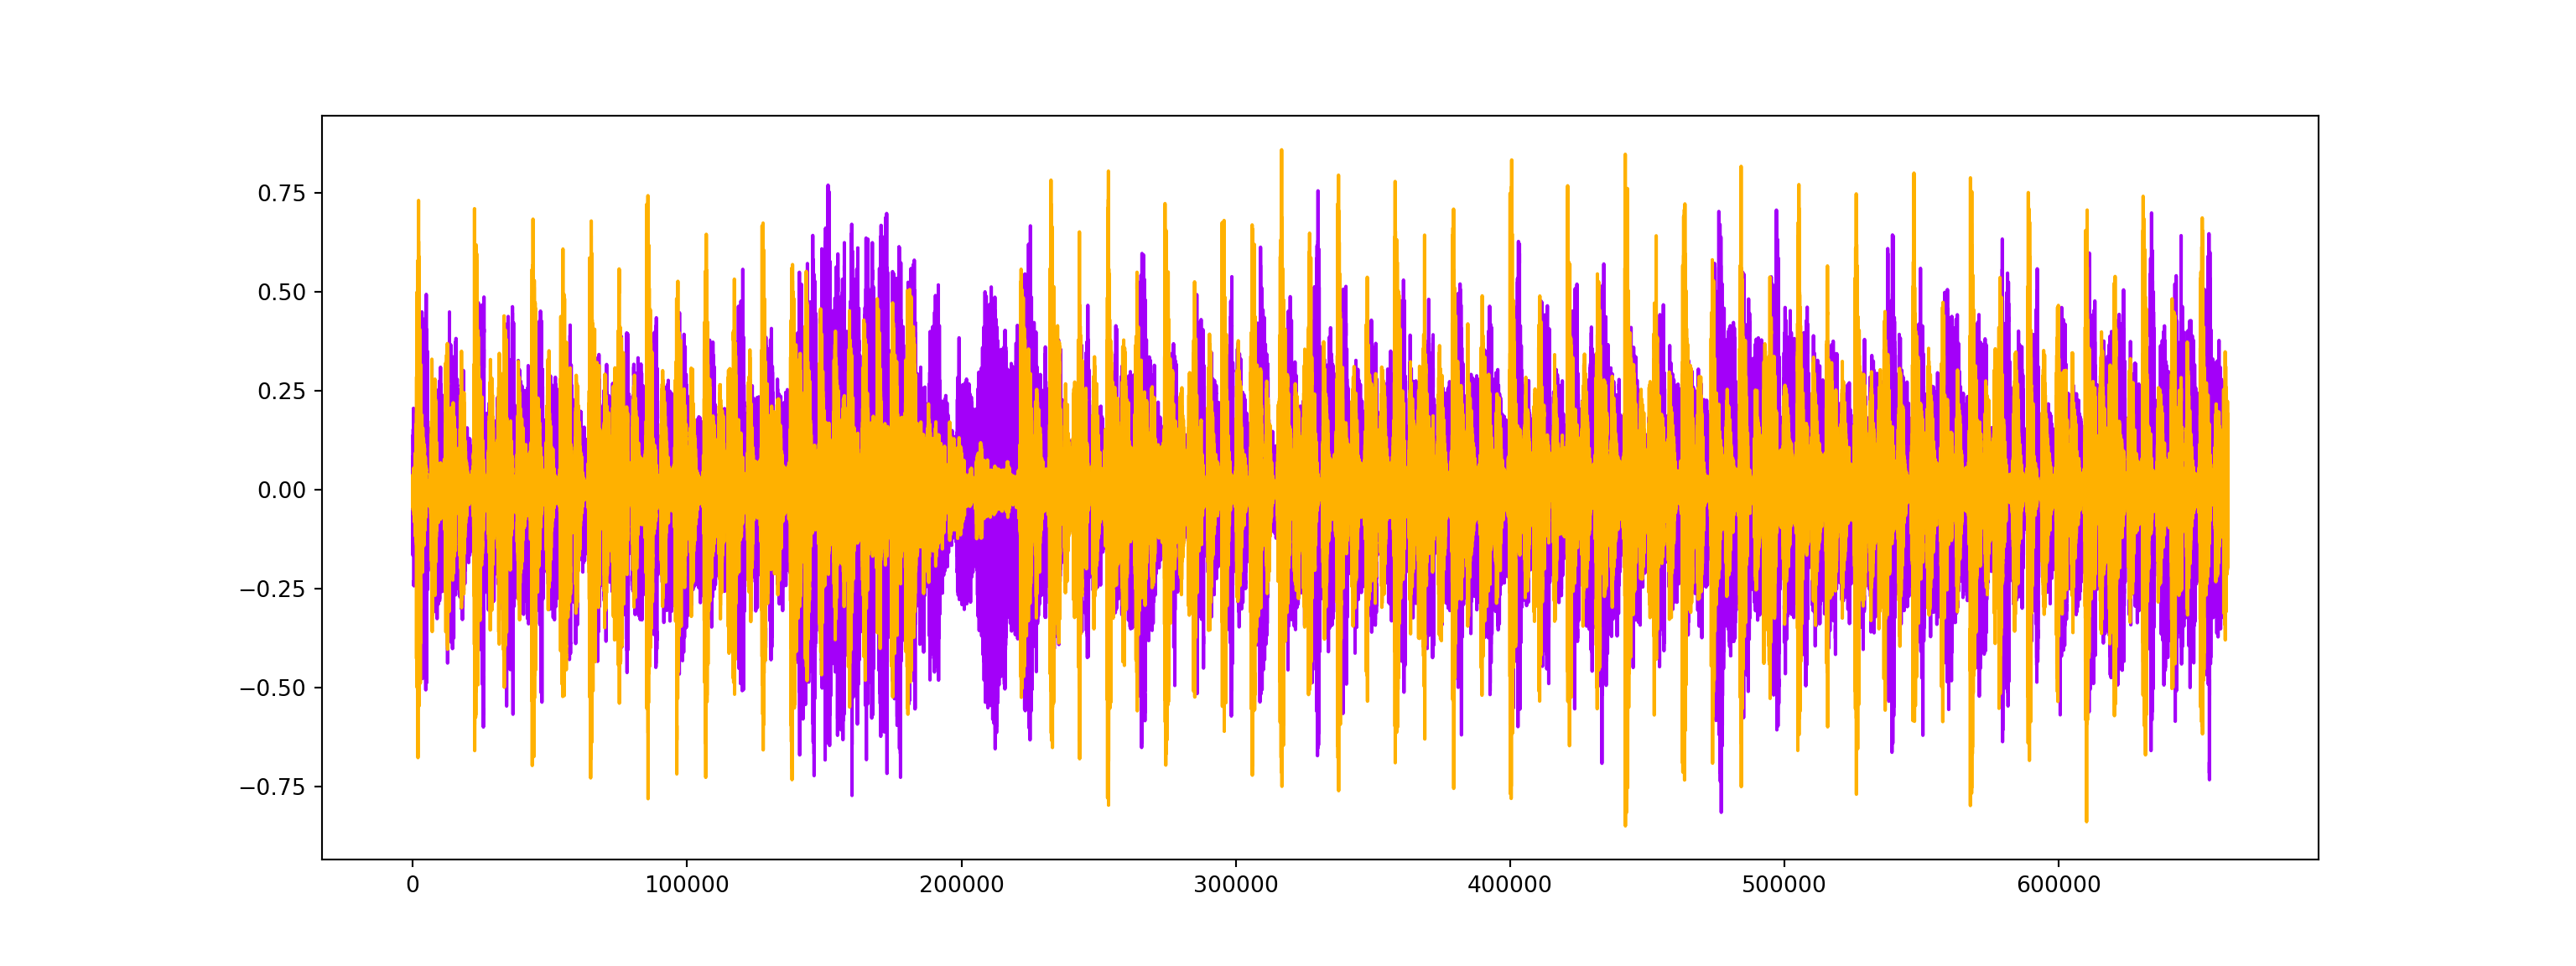
Applying Machine Learning to Audio Data: Visualization, Classification, and Recommendation
For this entry, I am trying my hands on audio data to extract its features for exploratory data analysis (EDA), using machine learning algorithms to perform music classification, and finally build up on that result to develop a recommendation system for music of similar characteristics. (13 min read)
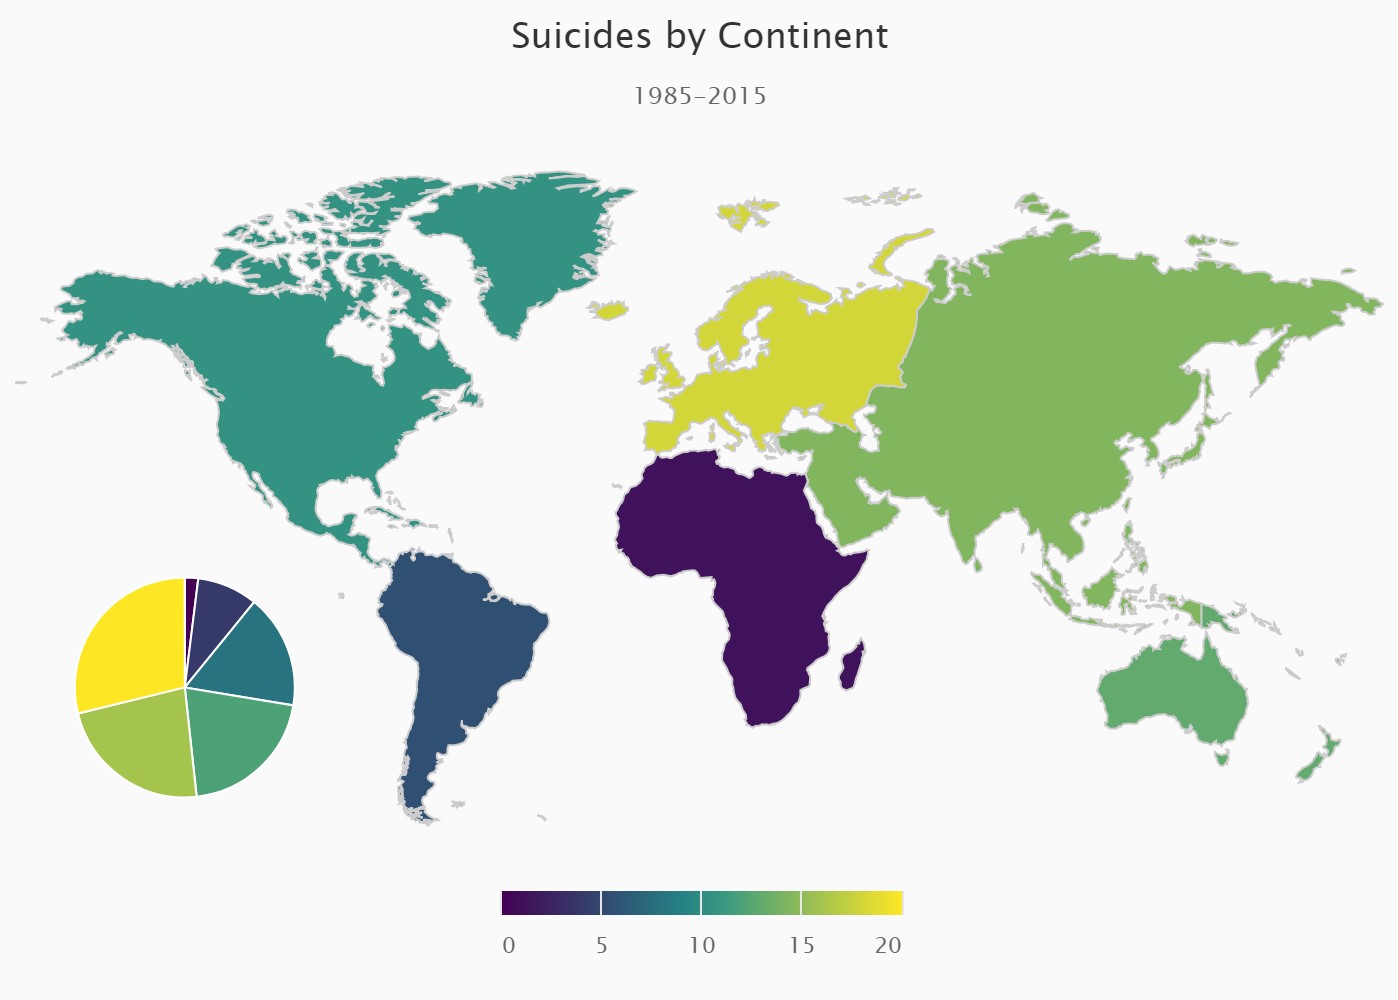
Interactive plots for Suicide Data
For this entry, will be visualizing suicide data from 1958 to 2015 with interactive plots to communicate insights to non-technical audience. (14 min read)
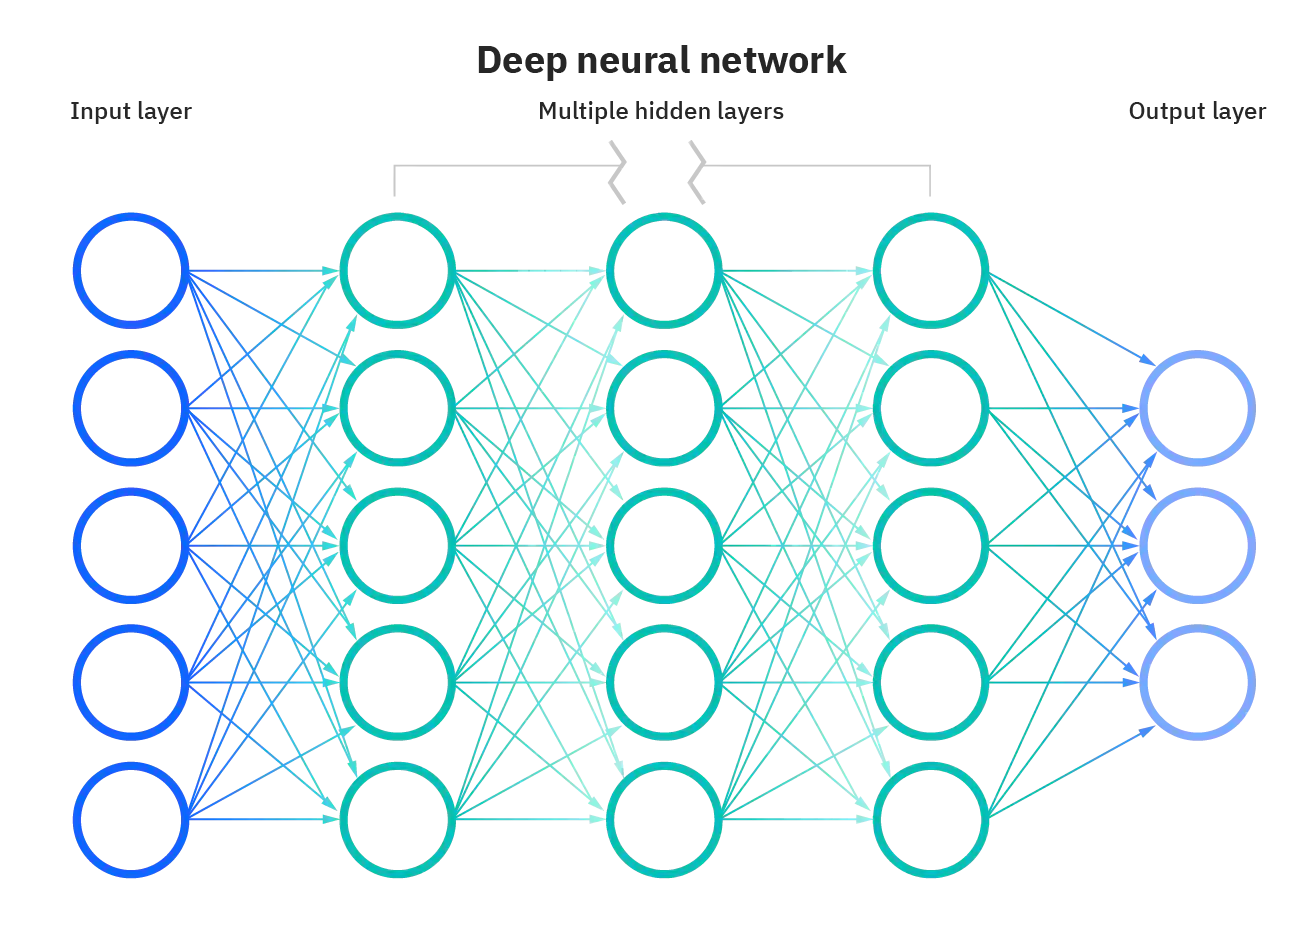
Image Recognition with Artificial Neural Networks
In this entry, we will be developing a deep learning algorithm - a sub-field of machine learning inspired by the structure of human brain (neural networks) - to classify images of single digit number (0-9). (9 min read)
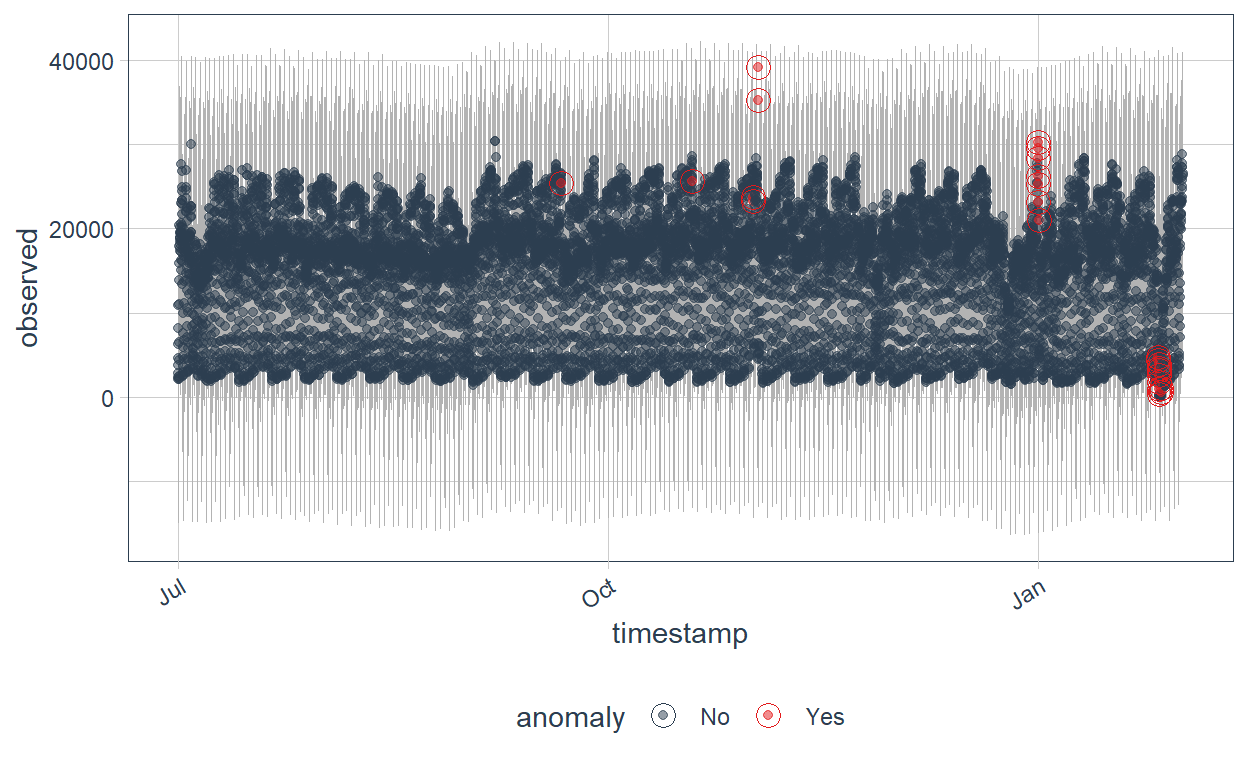
Anomaly Detection with New York City taxi data
In this entry, I will be conducting anomaly detection to identify points of anomaly in the taxi passengers data in New York City from July 2014 to January 2015 at half-hourly intervals. (4 min read)
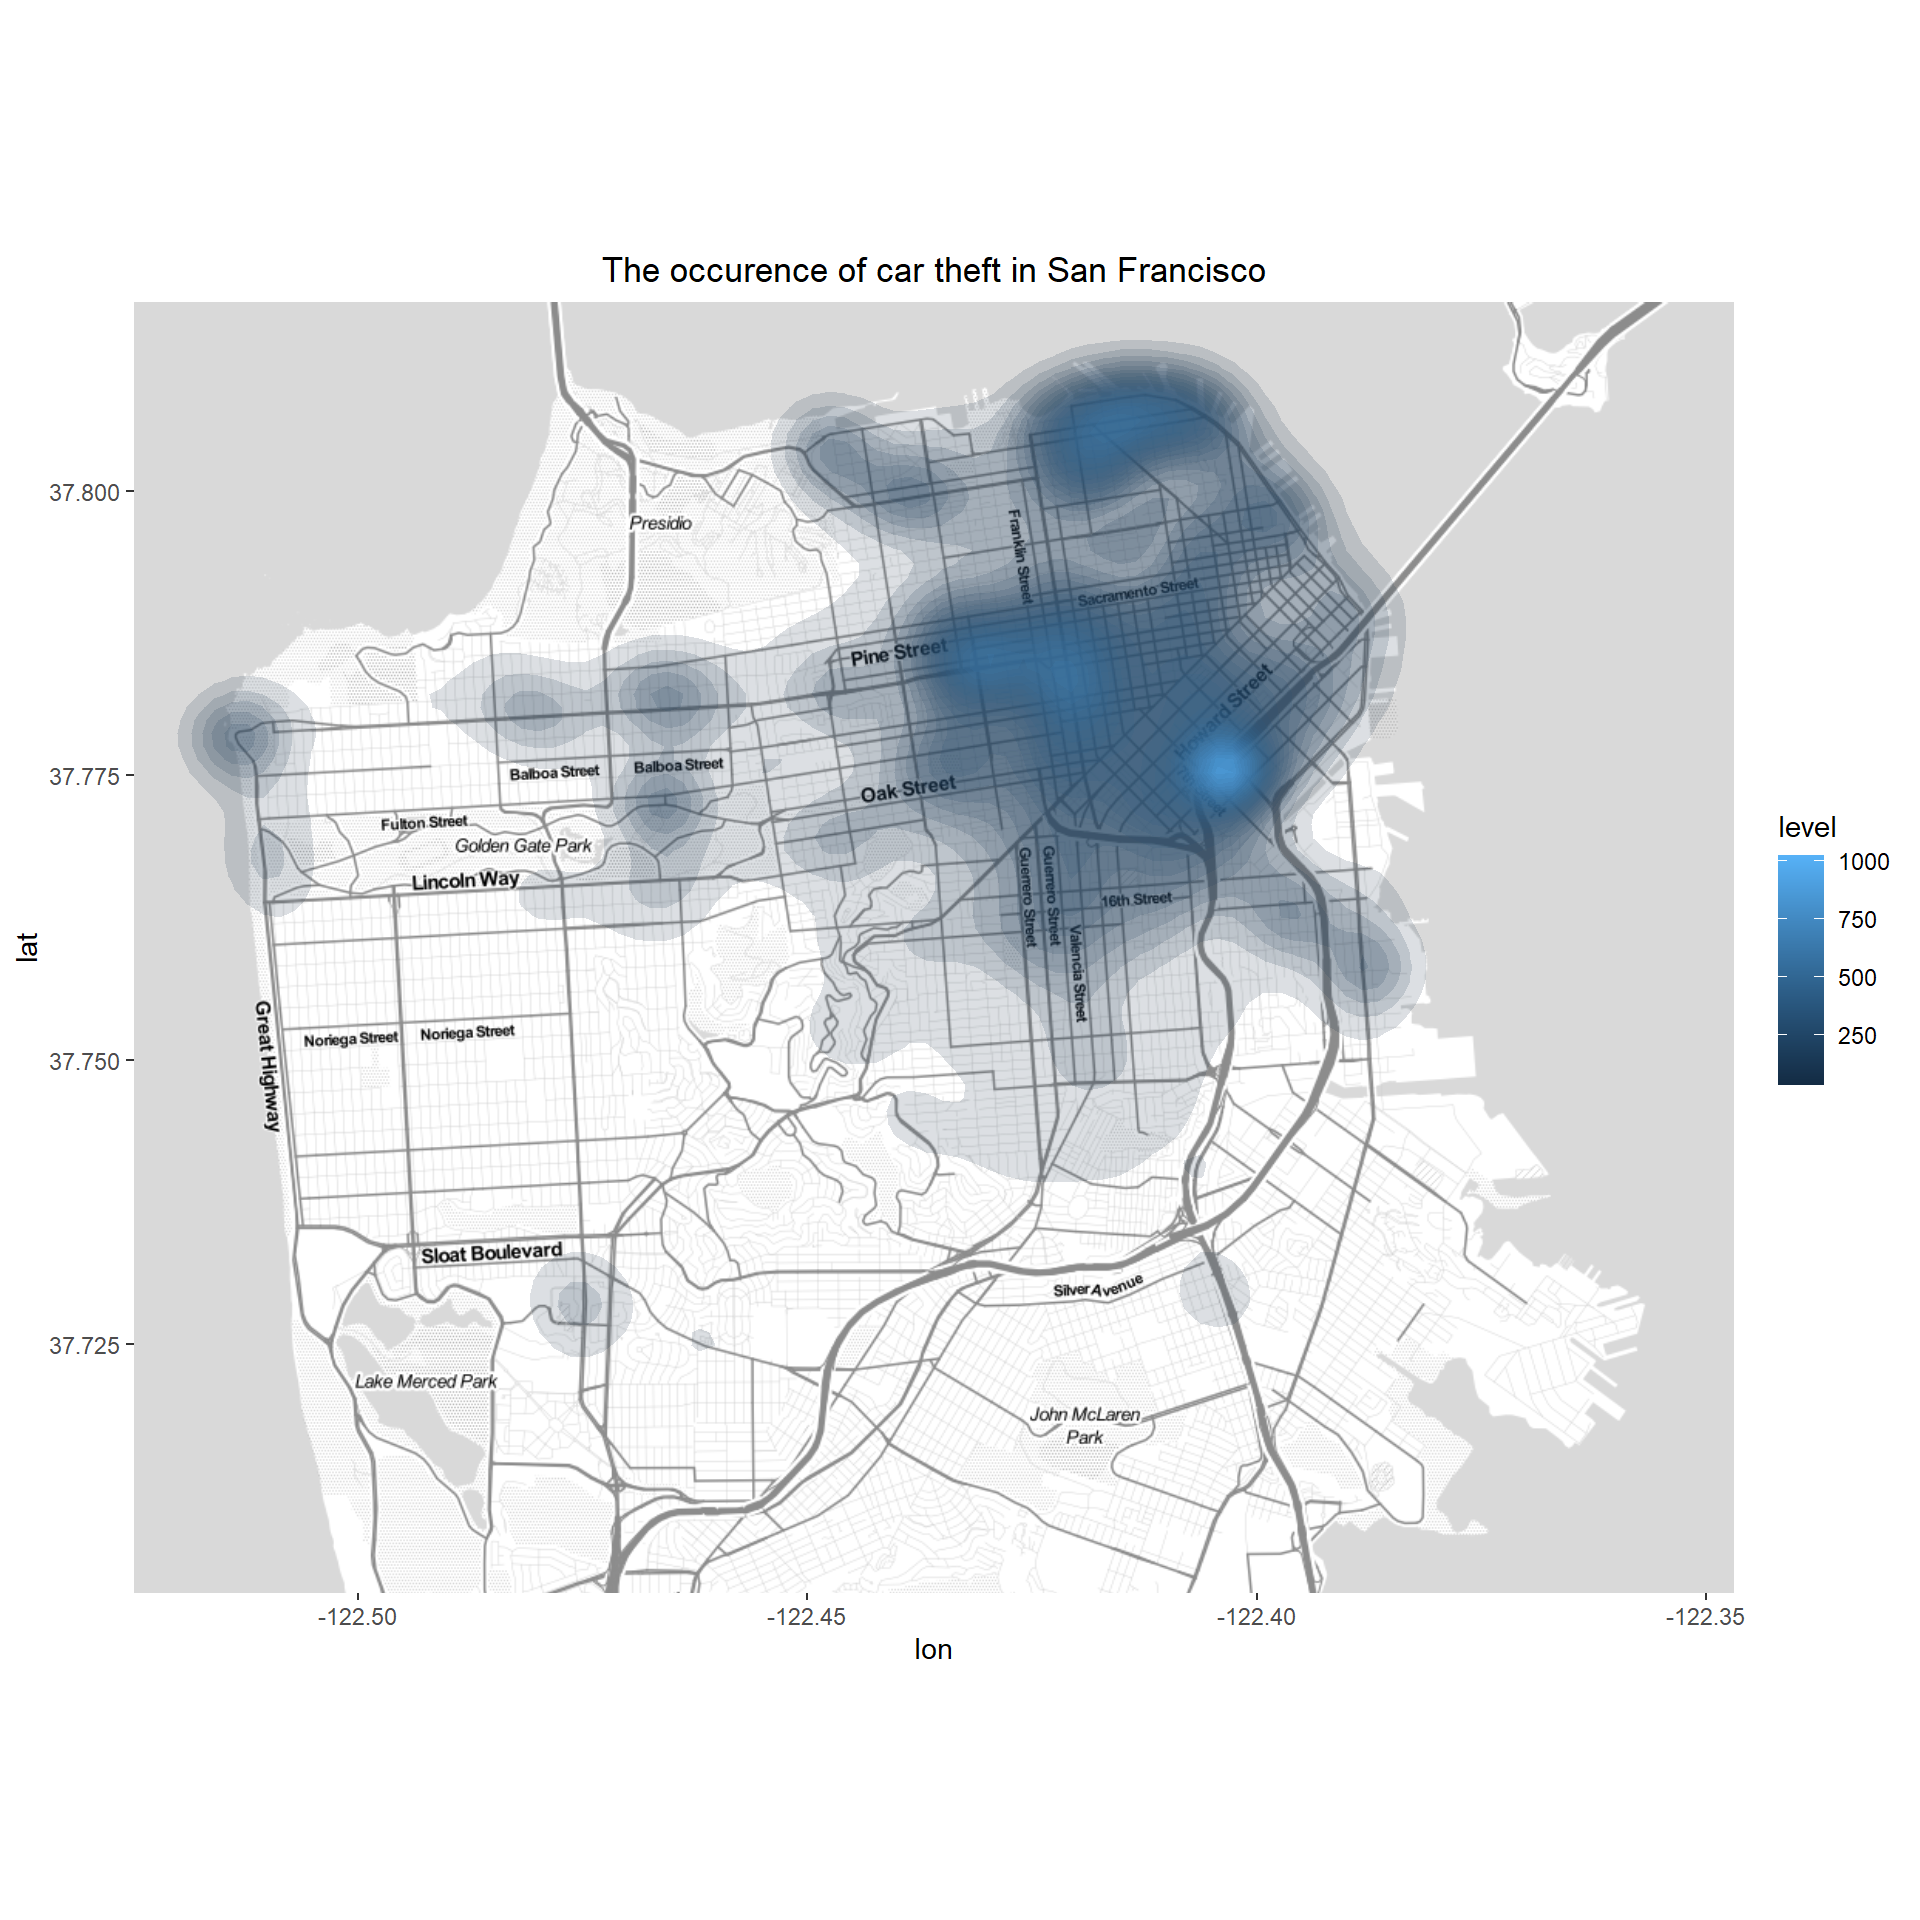
Crime mapping in San Francisco with police data
In this entry, we will explore San Francisco crime data from 2016 to 2018 to understand the relationship between civilian-reported incidents of crime and police-reported incidents of crime. Along the way we will use table intersection methods to subset our data, aggregation methods to calculate important statistics, and simple visualizations to understand crime trends. (7 min read)
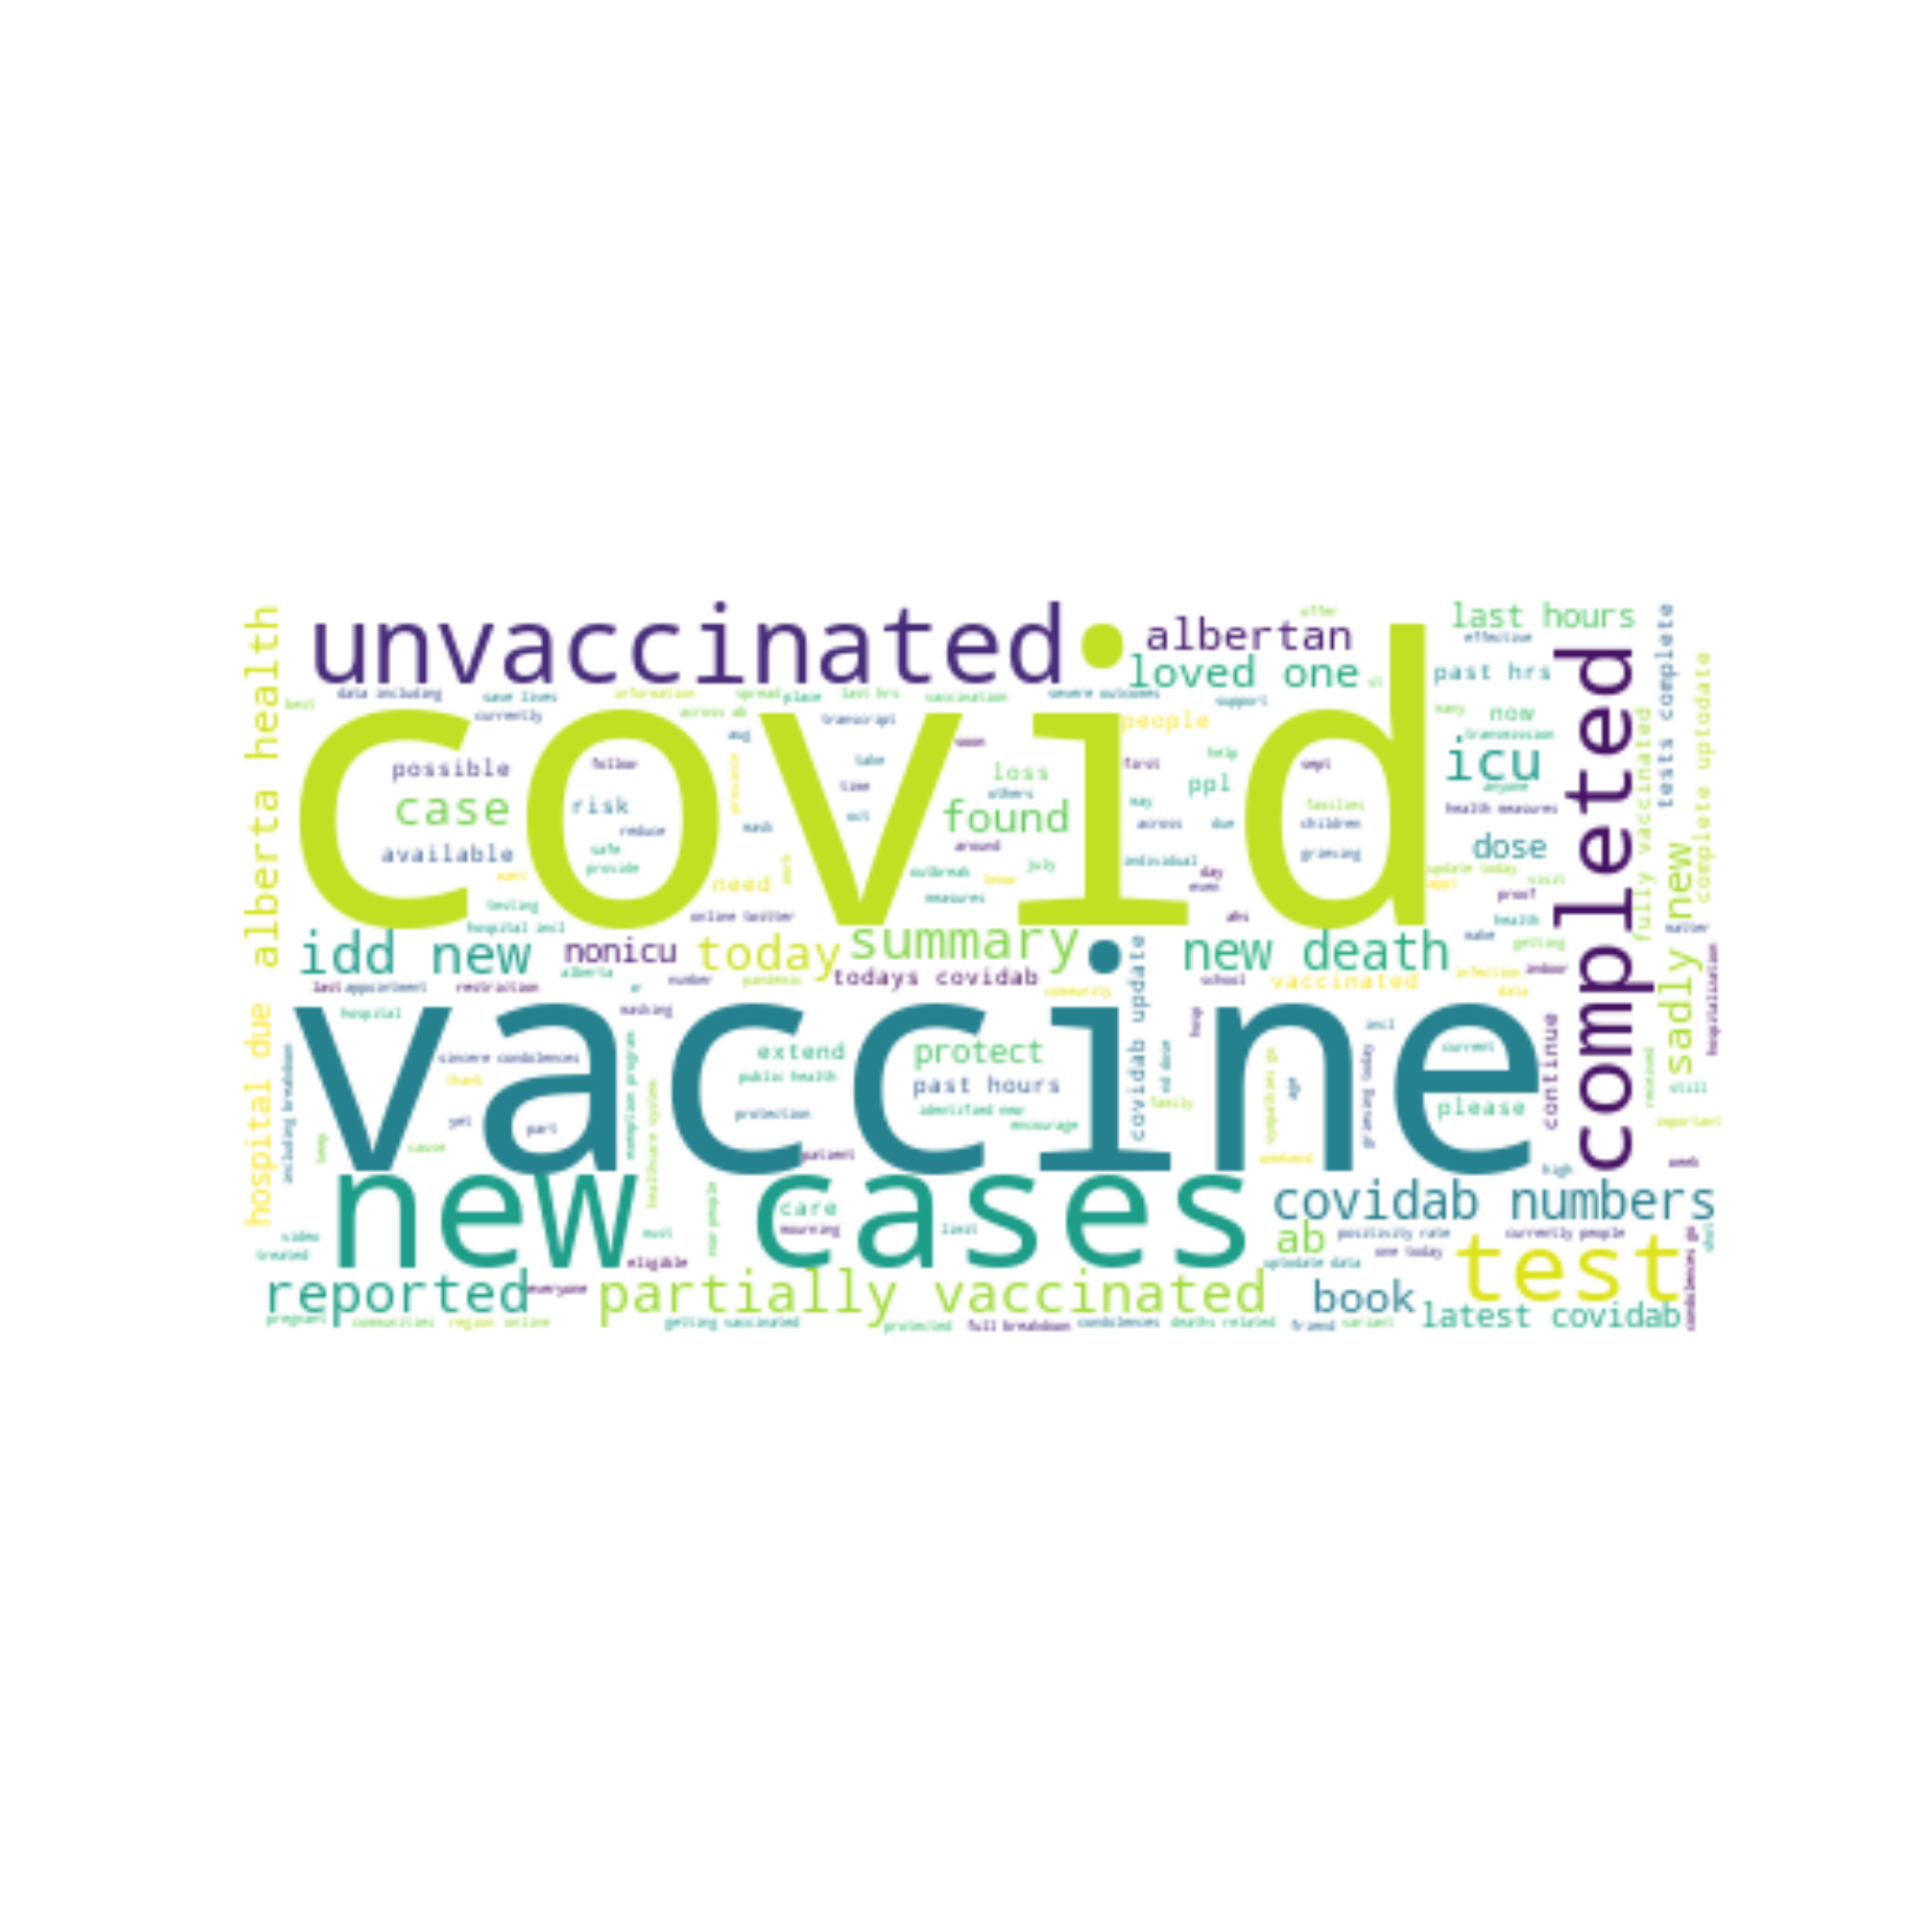
Exploring COVID-19 data from twitter with topic modeling
This entry focuses on the exploration of twitter data from Alberta's Chief Medical Officer of Health via word cloud and topic modeling to gain insights in characteristics of public health messaging during the COVID-19 pandemic. (7 min read)
Finding a home among the paradigm push-back with Dialectical Pluralism
This entry discusses the reconciliation of quantitative and qualitative worldviews amidst the paradigm wars with pluralistic stance. (2 min read)